Open Access
Fig. 8.
Download original image
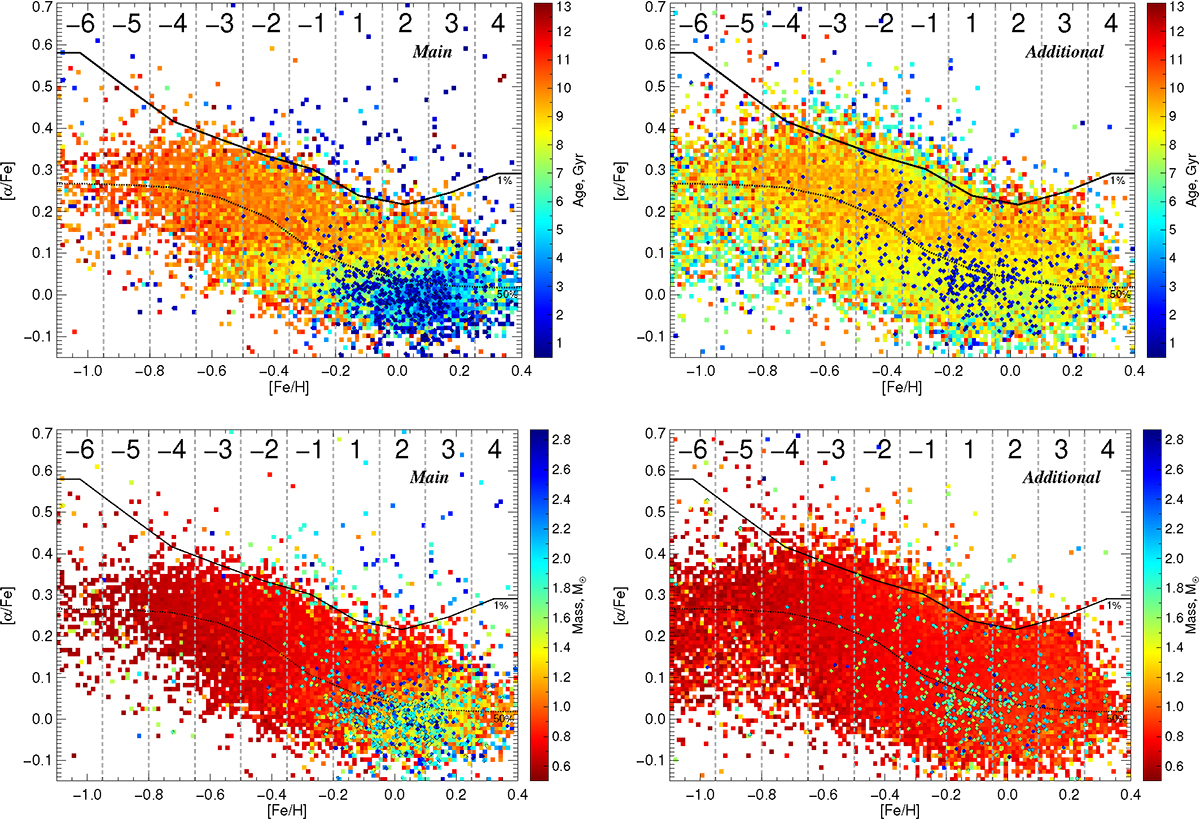
Properties of the giants of the main and additional samples (left and right columns, respectively) in the Tinsley–Wallerstein diagram. Small squares represent bins with more than five stars. Blue points show the positions of young (< 3 Gyr) stars.
Current usage metrics show cumulative count of Article Views (full-text article views including HTML views, PDF and ePub downloads, according to the available data) and Abstracts Views on Vision4Press platform.
Data correspond to usage on the plateform after 2015. The current usage metrics is available 48-96 hours after online publication and is updated daily on week days.
Initial download of the metrics may take a while.