Open Access
Fig. 7.
Download original image
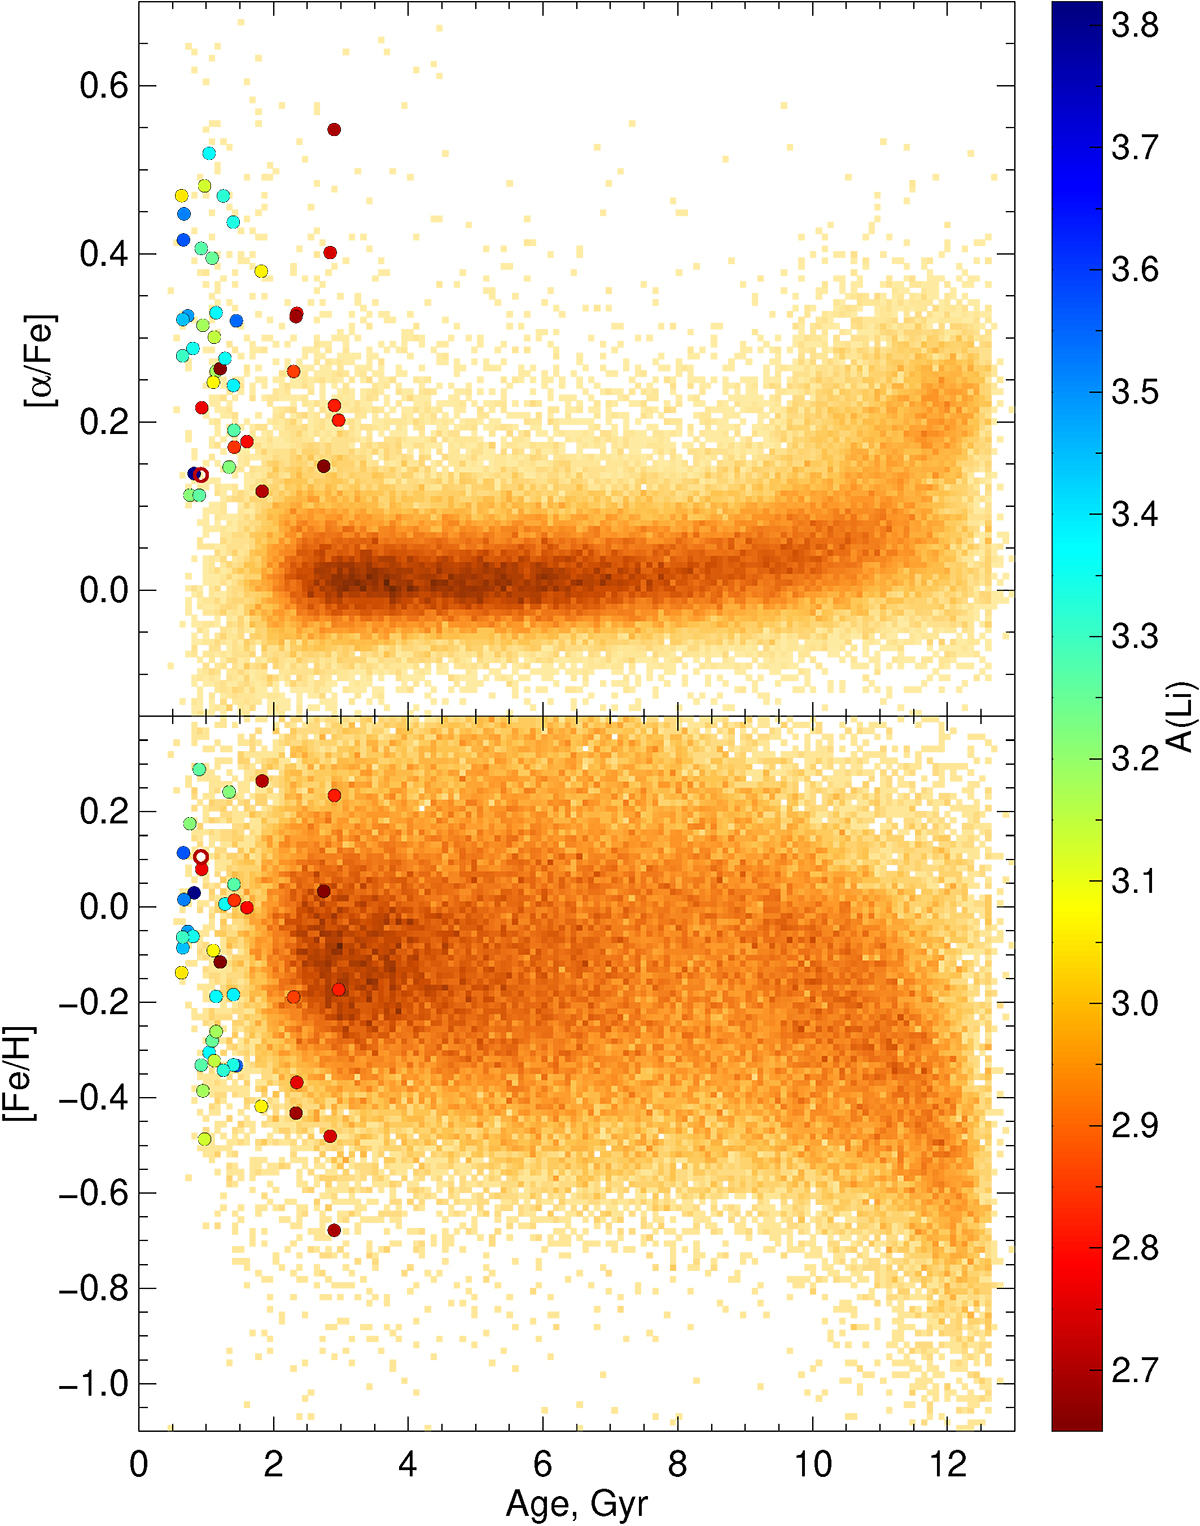
Number density plots showing [α/Fe] and [Fe/H] (upper and bottom panels respectively) as a function of age for the main dwarf sample. Color-coded circles show the positions of the y-exαFe stars with A(Li) > 2.65 of the main and additional samples (filled and open circles, respectively)
Current usage metrics show cumulative count of Article Views (full-text article views including HTML views, PDF and ePub downloads, according to the available data) and Abstracts Views on Vision4Press platform.
Data correspond to usage on the plateform after 2015. The current usage metrics is available 48-96 hours after online publication and is updated daily on week days.
Initial download of the metrics may take a while.