Fig. 2.
Download original image
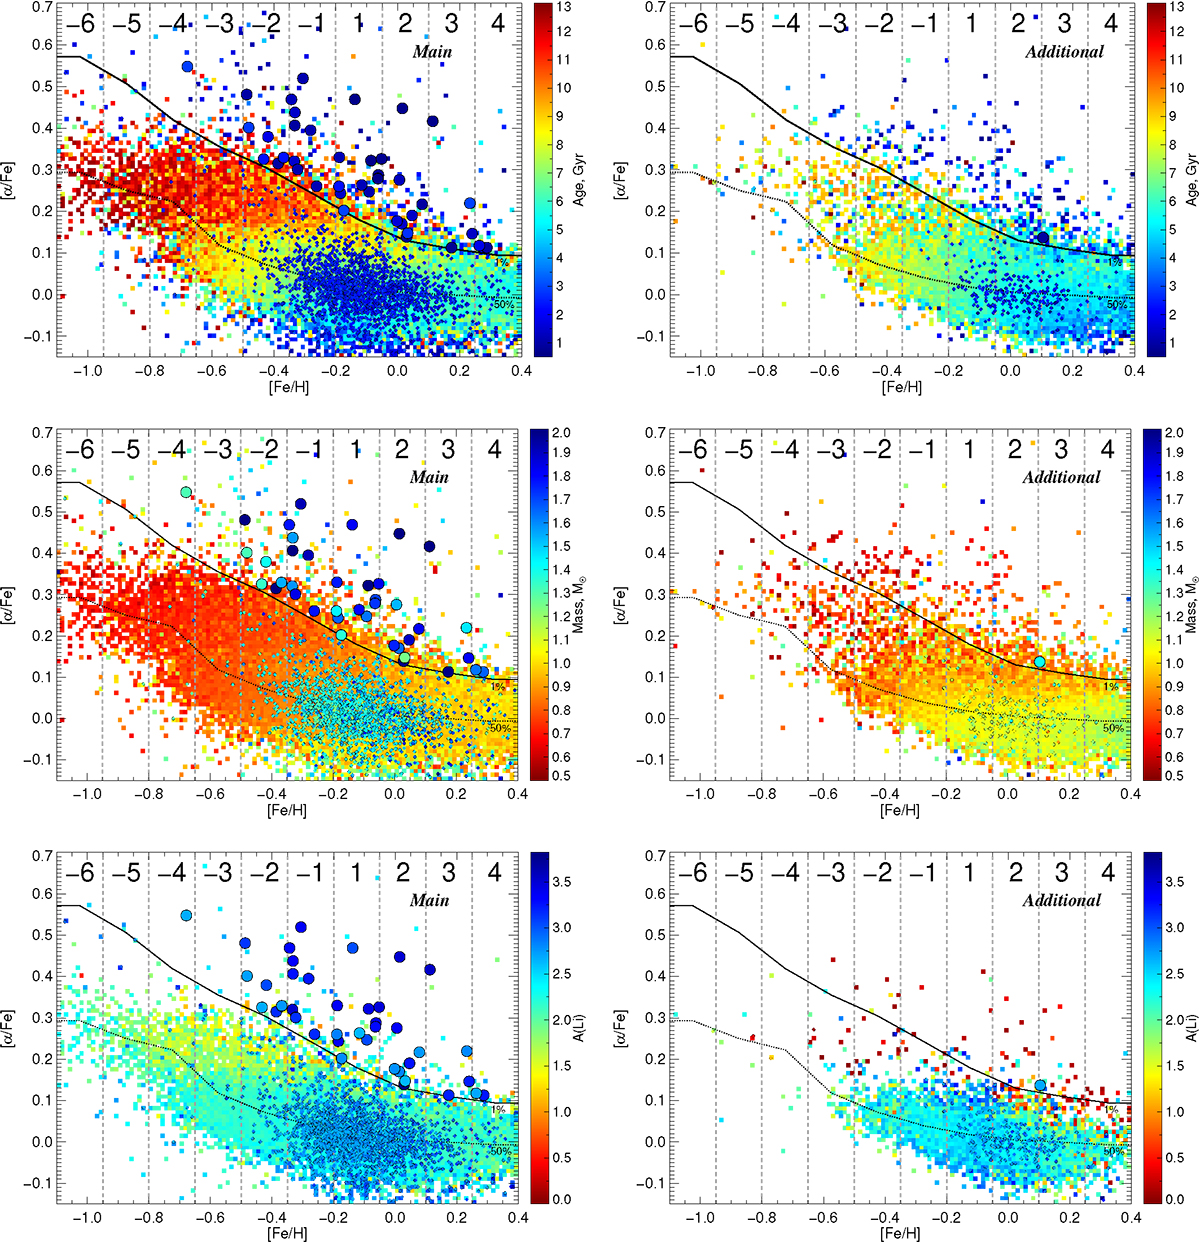
Properties of the dwarf stars of the main and additional samples (left and right columns, respectively; see details in Table 1) in the Tinsley–Wallerstein diagram. The solid curve separates the top 1% of stars in each of the 10 metallicity bins from the remaining 99% (exαFe and [α/Fe]-normal stars, respectively), whereas the dashed curve is the median (50% of stars above and below it). From top to bottom: ages, masses, and Li abundances are color-coded, with the color of the background indicating the mean value of the property in bins of size 0.0125 dex in [Fe/H] and 0.0094 dex in [α/Fe]. Individual stars with age ≤3 Gyr and A(Li) ≥ 2.65 dex are also indicated by big and small points for stars above and below the top 1% curve, respectively.
Current usage metrics show cumulative count of Article Views (full-text article views including HTML views, PDF and ePub downloads, according to the available data) and Abstracts Views on Vision4Press platform.
Data correspond to usage on the plateform after 2015. The current usage metrics is available 48-96 hours after online publication and is updated daily on week days.
Initial download of the metrics may take a while.