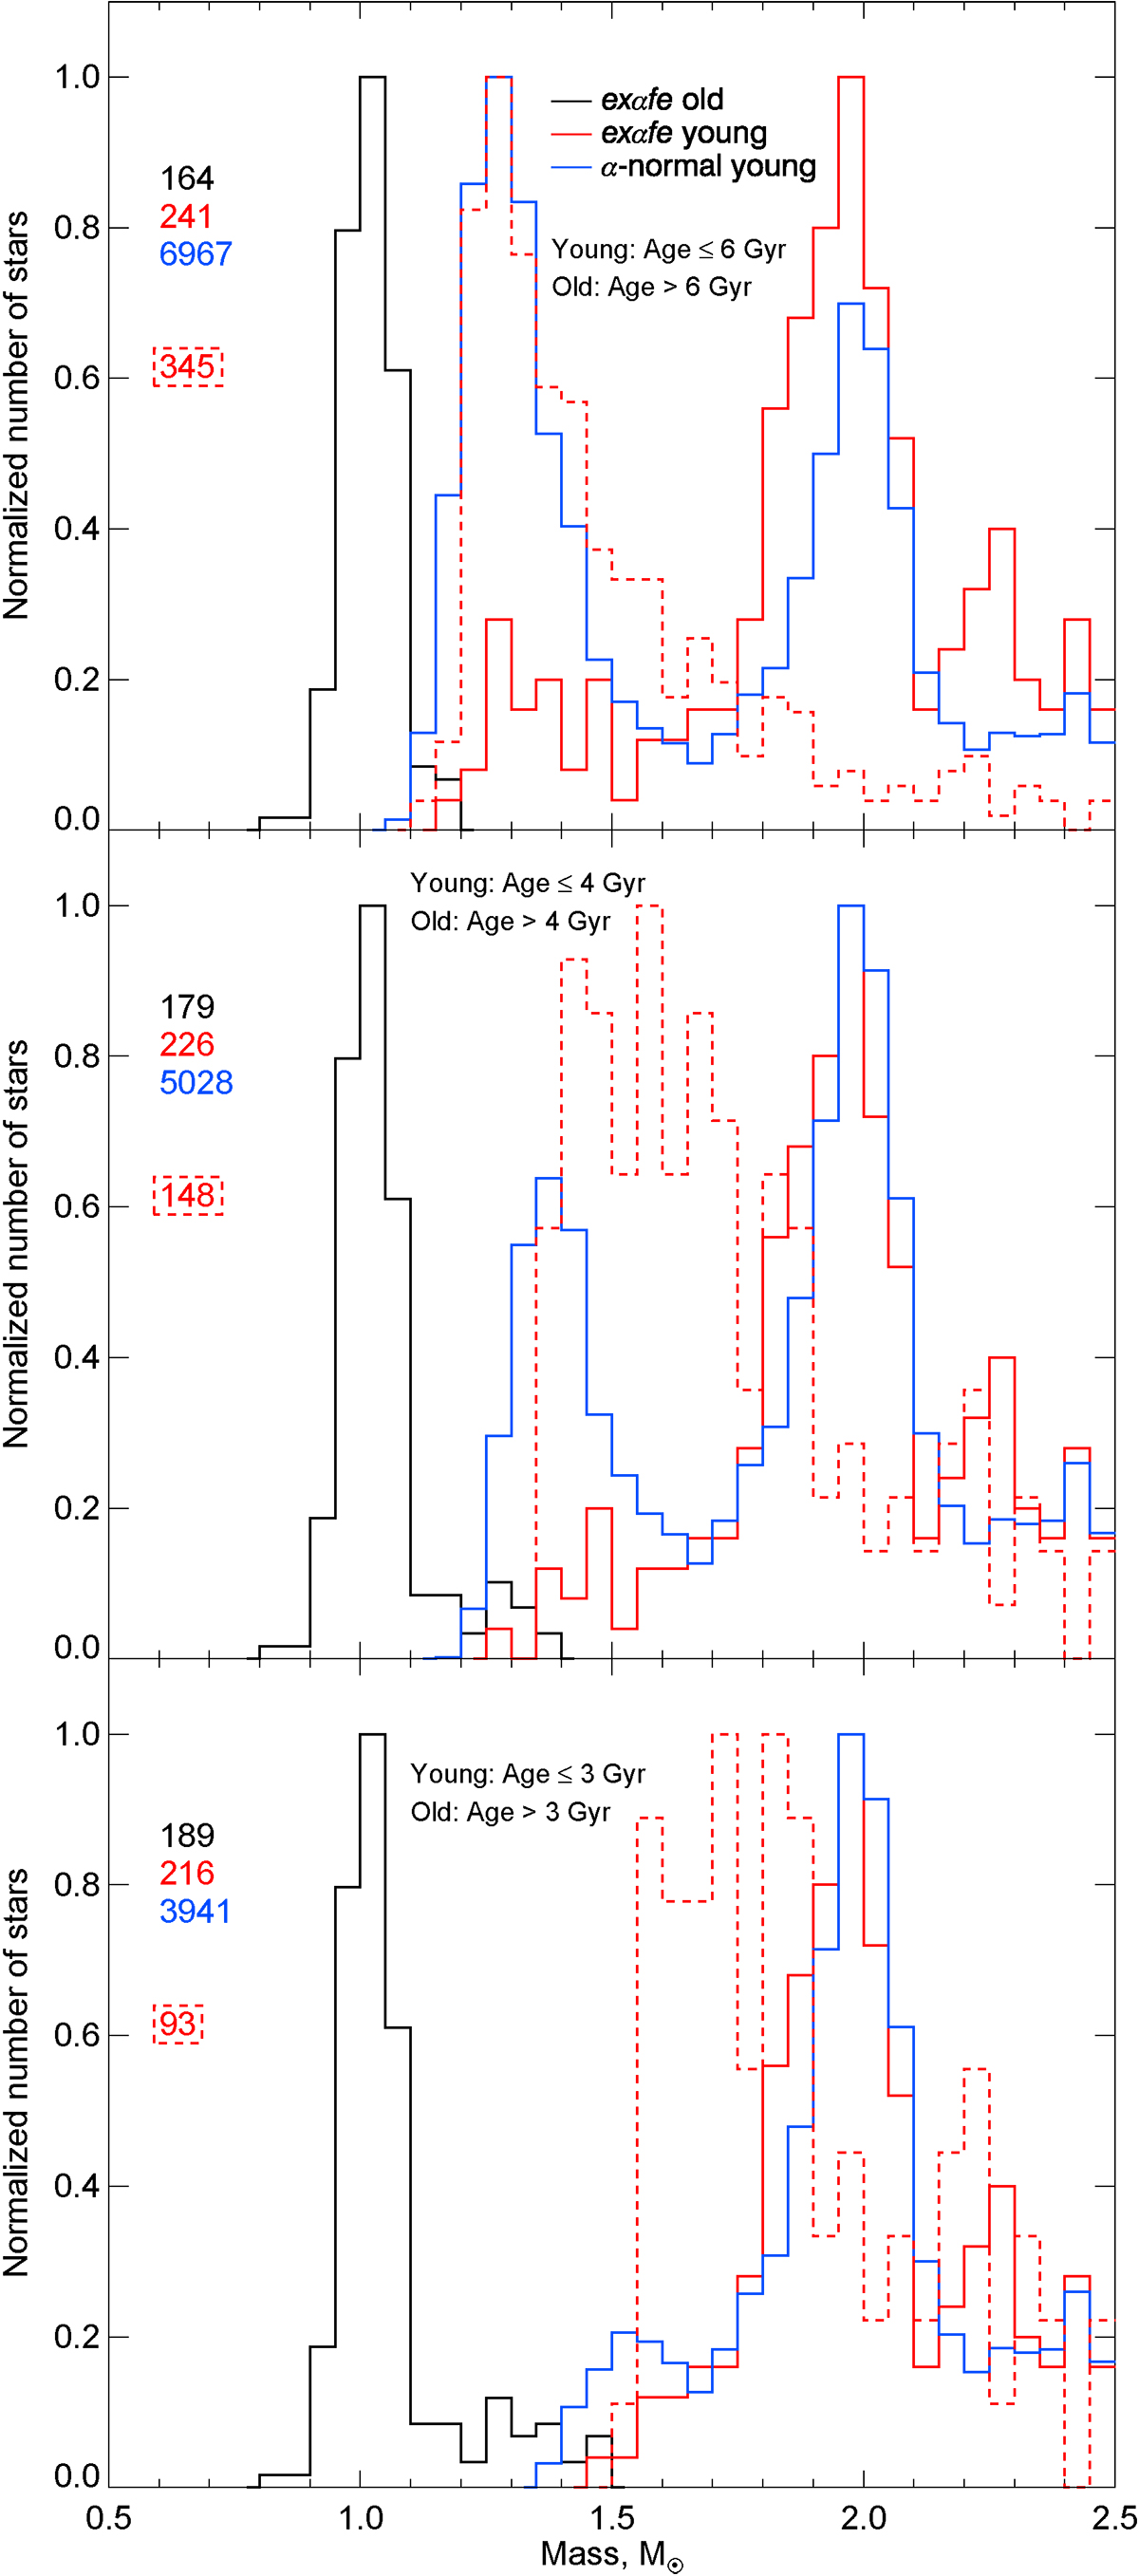
Fig. 10.
Download original image
Mass distribution of the giant stars assuming different age limits (3, 4, and 6 Gyr from bottom to top). Red histograms correspond to y-exαFe (i.e., younger than the age cut) giants of the main and additional samples (full and dotted respectively). The blue and black histograms correspond respectively to the young [α/Fe]-normal giants and to exαFe giants older than the cut (for these two cases we show only the distributions of the main sample stars). All the histograms are scaled to have the same height for the purpose of visibility, and the numbers on the left give the number of stars in each color-coded class of giants.
Current usage metrics show cumulative count of Article Views (full-text article views including HTML views, PDF and ePub downloads, according to the available data) and Abstracts Views on Vision4Press platform.
Data correspond to usage on the plateform after 2015. The current usage metrics is available 48-96 hours after online publication and is updated daily on week days.
Initial download of the metrics may take a while.