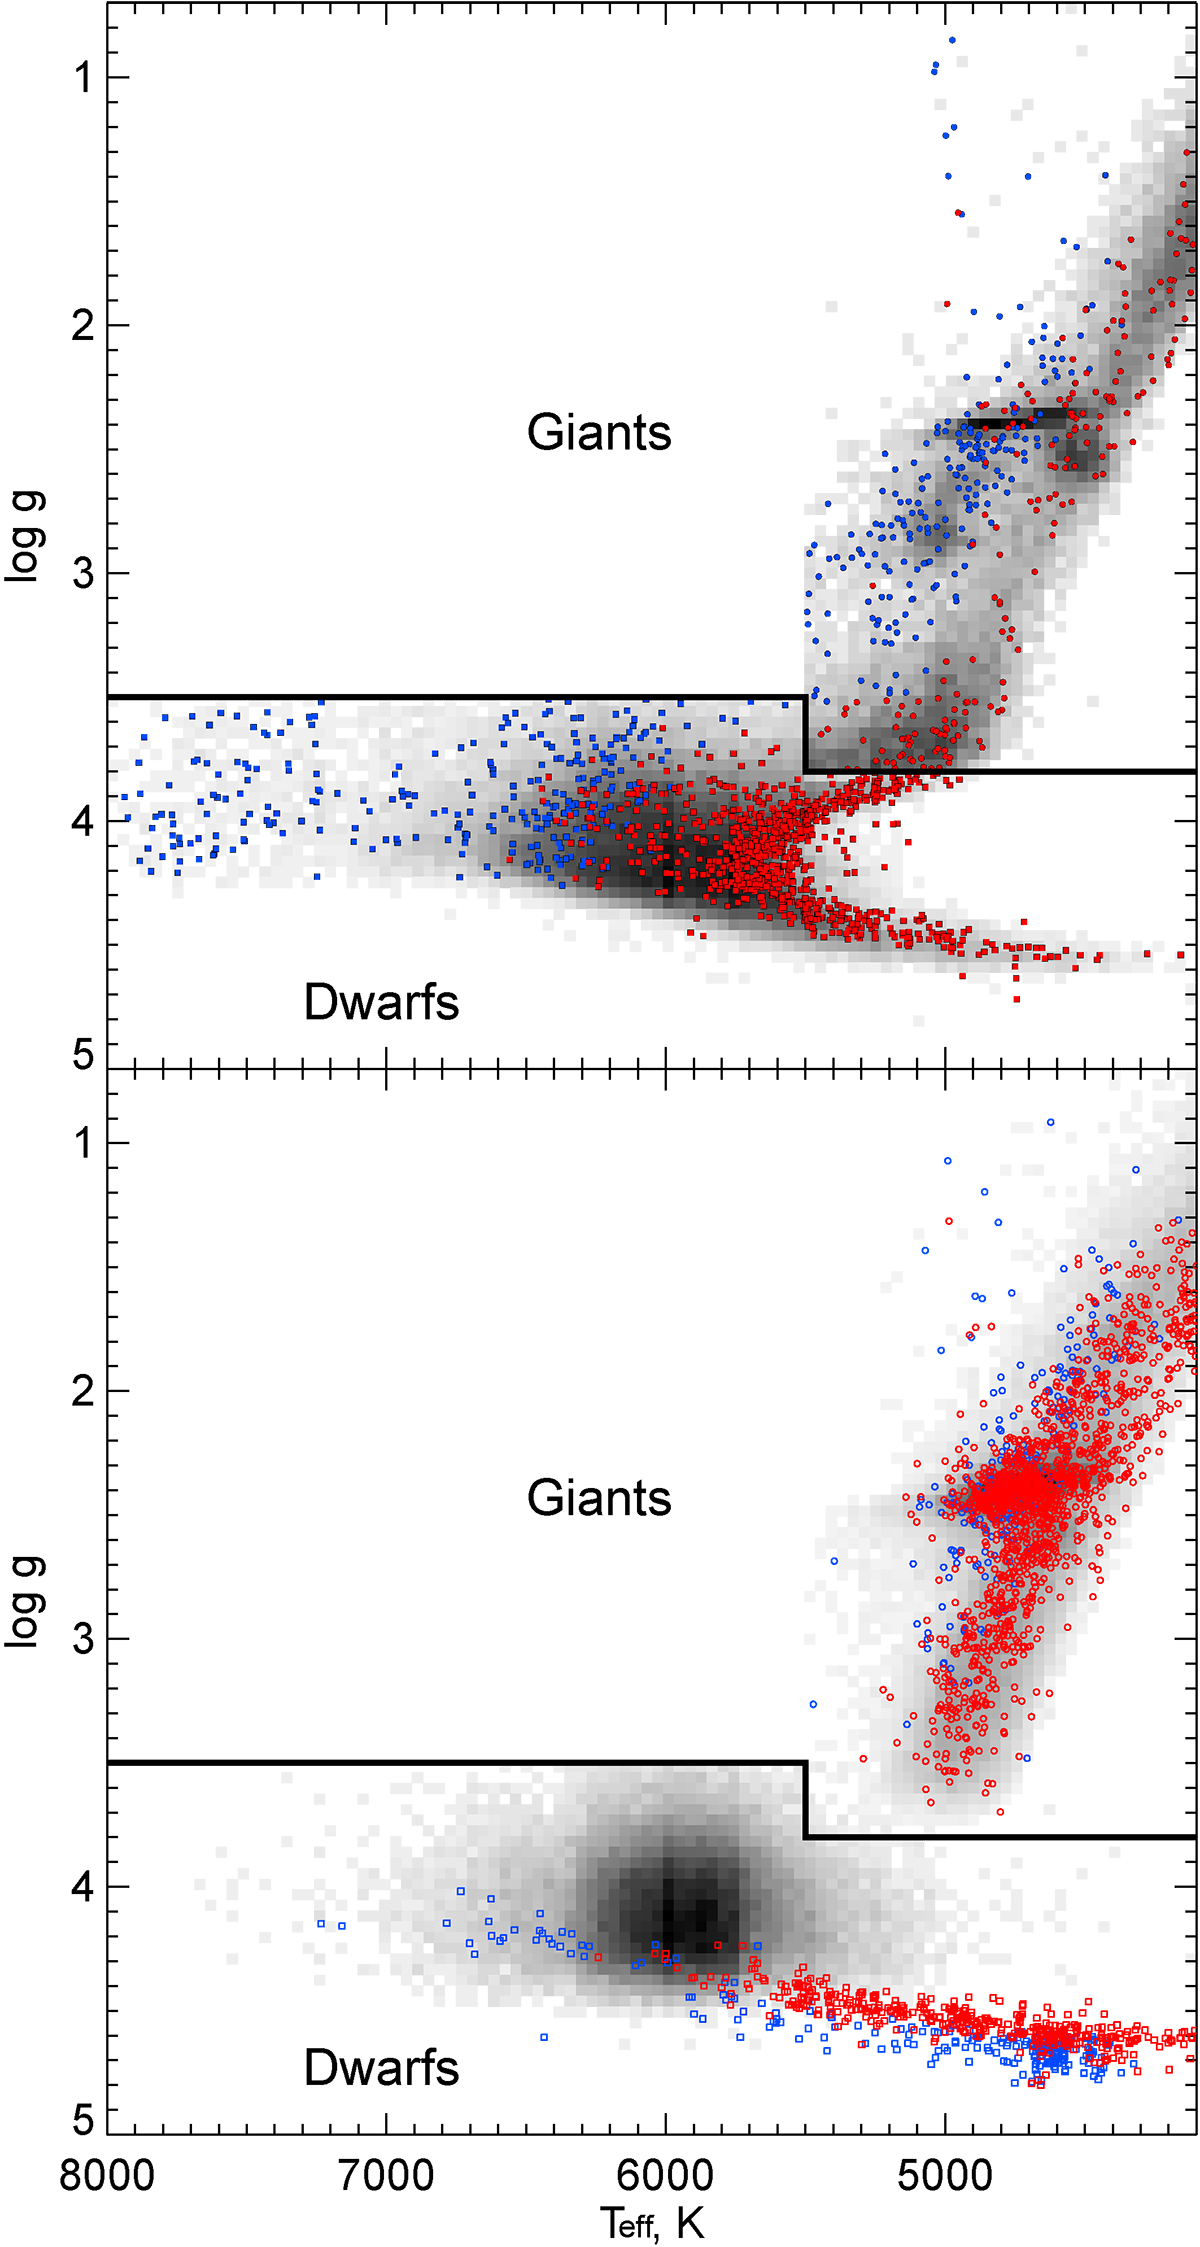
Fig. 1.
Download original image
Kiel diagram for the dwarf and giant stars selected from GALAH DR3. Upper panel: number density plot showing the positions of α-normal stars of the main samples of dwarfs and giants. Squares show the positions of extreme [α/Fe]-rich (exαFe, see Sect. 2.2.1) dwarf stars: y-exαFe (age ≤ 3 Gyr) and older exαFe are shown by blue and red squares, respectively. We keep the same notations, but in circles, for giants. Bottom panel: same details, but for stars in the additional sample (open symbols).
Current usage metrics show cumulative count of Article Views (full-text article views including HTML views, PDF and ePub downloads, according to the available data) and Abstracts Views on Vision4Press platform.
Data correspond to usage on the plateform after 2015. The current usage metrics is available 48-96 hours after online publication and is updated daily on week days.
Initial download of the metrics may take a while.