Fig. 8.
Download original image
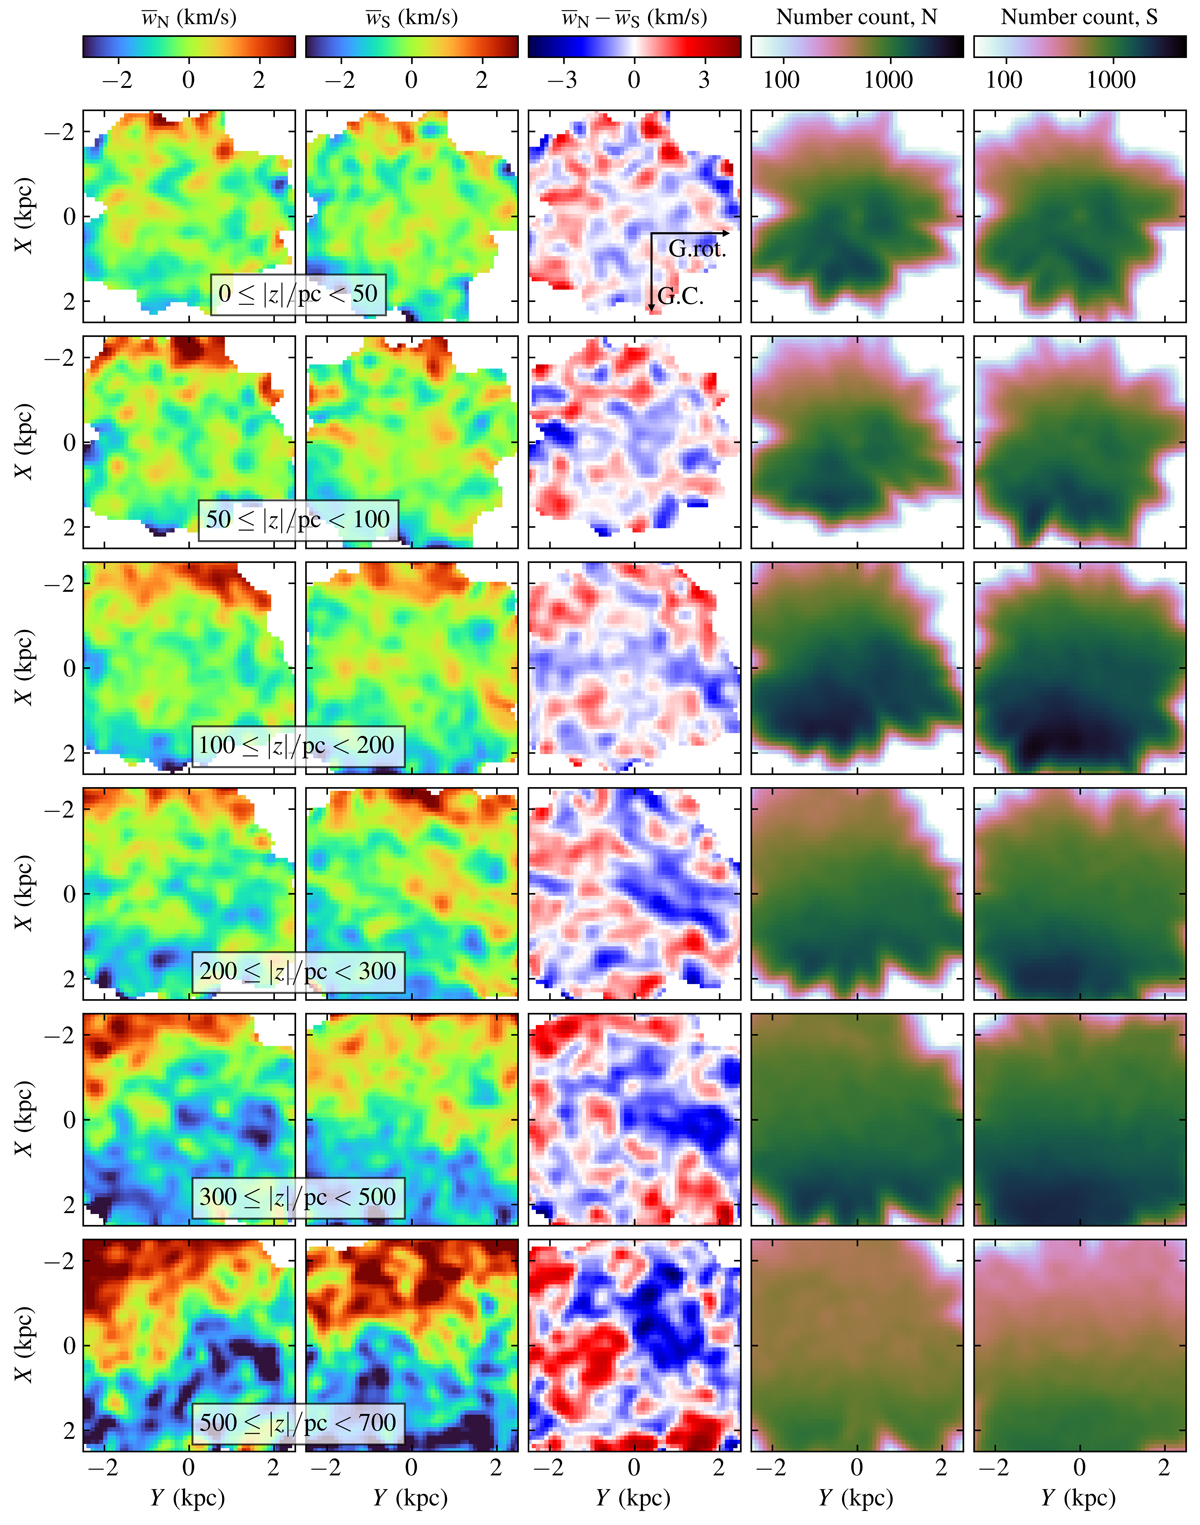
Mean vertical velocities of the data sample with 0 < MG ≤ 1, in the same spatial volumes as in Fig. 5. The results of each bin in z are averaged over a larger area in the (X, Y)-plane for better visibility; the (X, Y)-grid is convolved with a 2D Gaussian with a standard deviation of 150 pc. The two right columns show the number count in the respective spatial volumes; these quantities account for the smoothing in the (X, Y)-plane and correspond to the effective number of stars that inform the ![]() value. A volume cell is masked when this effective stellar number count falls below 100.
value. A volume cell is masked when this effective stellar number count falls below 100.
Current usage metrics show cumulative count of Article Views (full-text article views including HTML views, PDF and ePub downloads, according to the available data) and Abstracts Views on Vision4Press platform.
Data correspond to usage on the plateform after 2015. The current usage metrics is available 48-96 hours after online publication and is updated daily on week days.
Initial download of the metrics may take a while.