Fig. 5.
Download original image
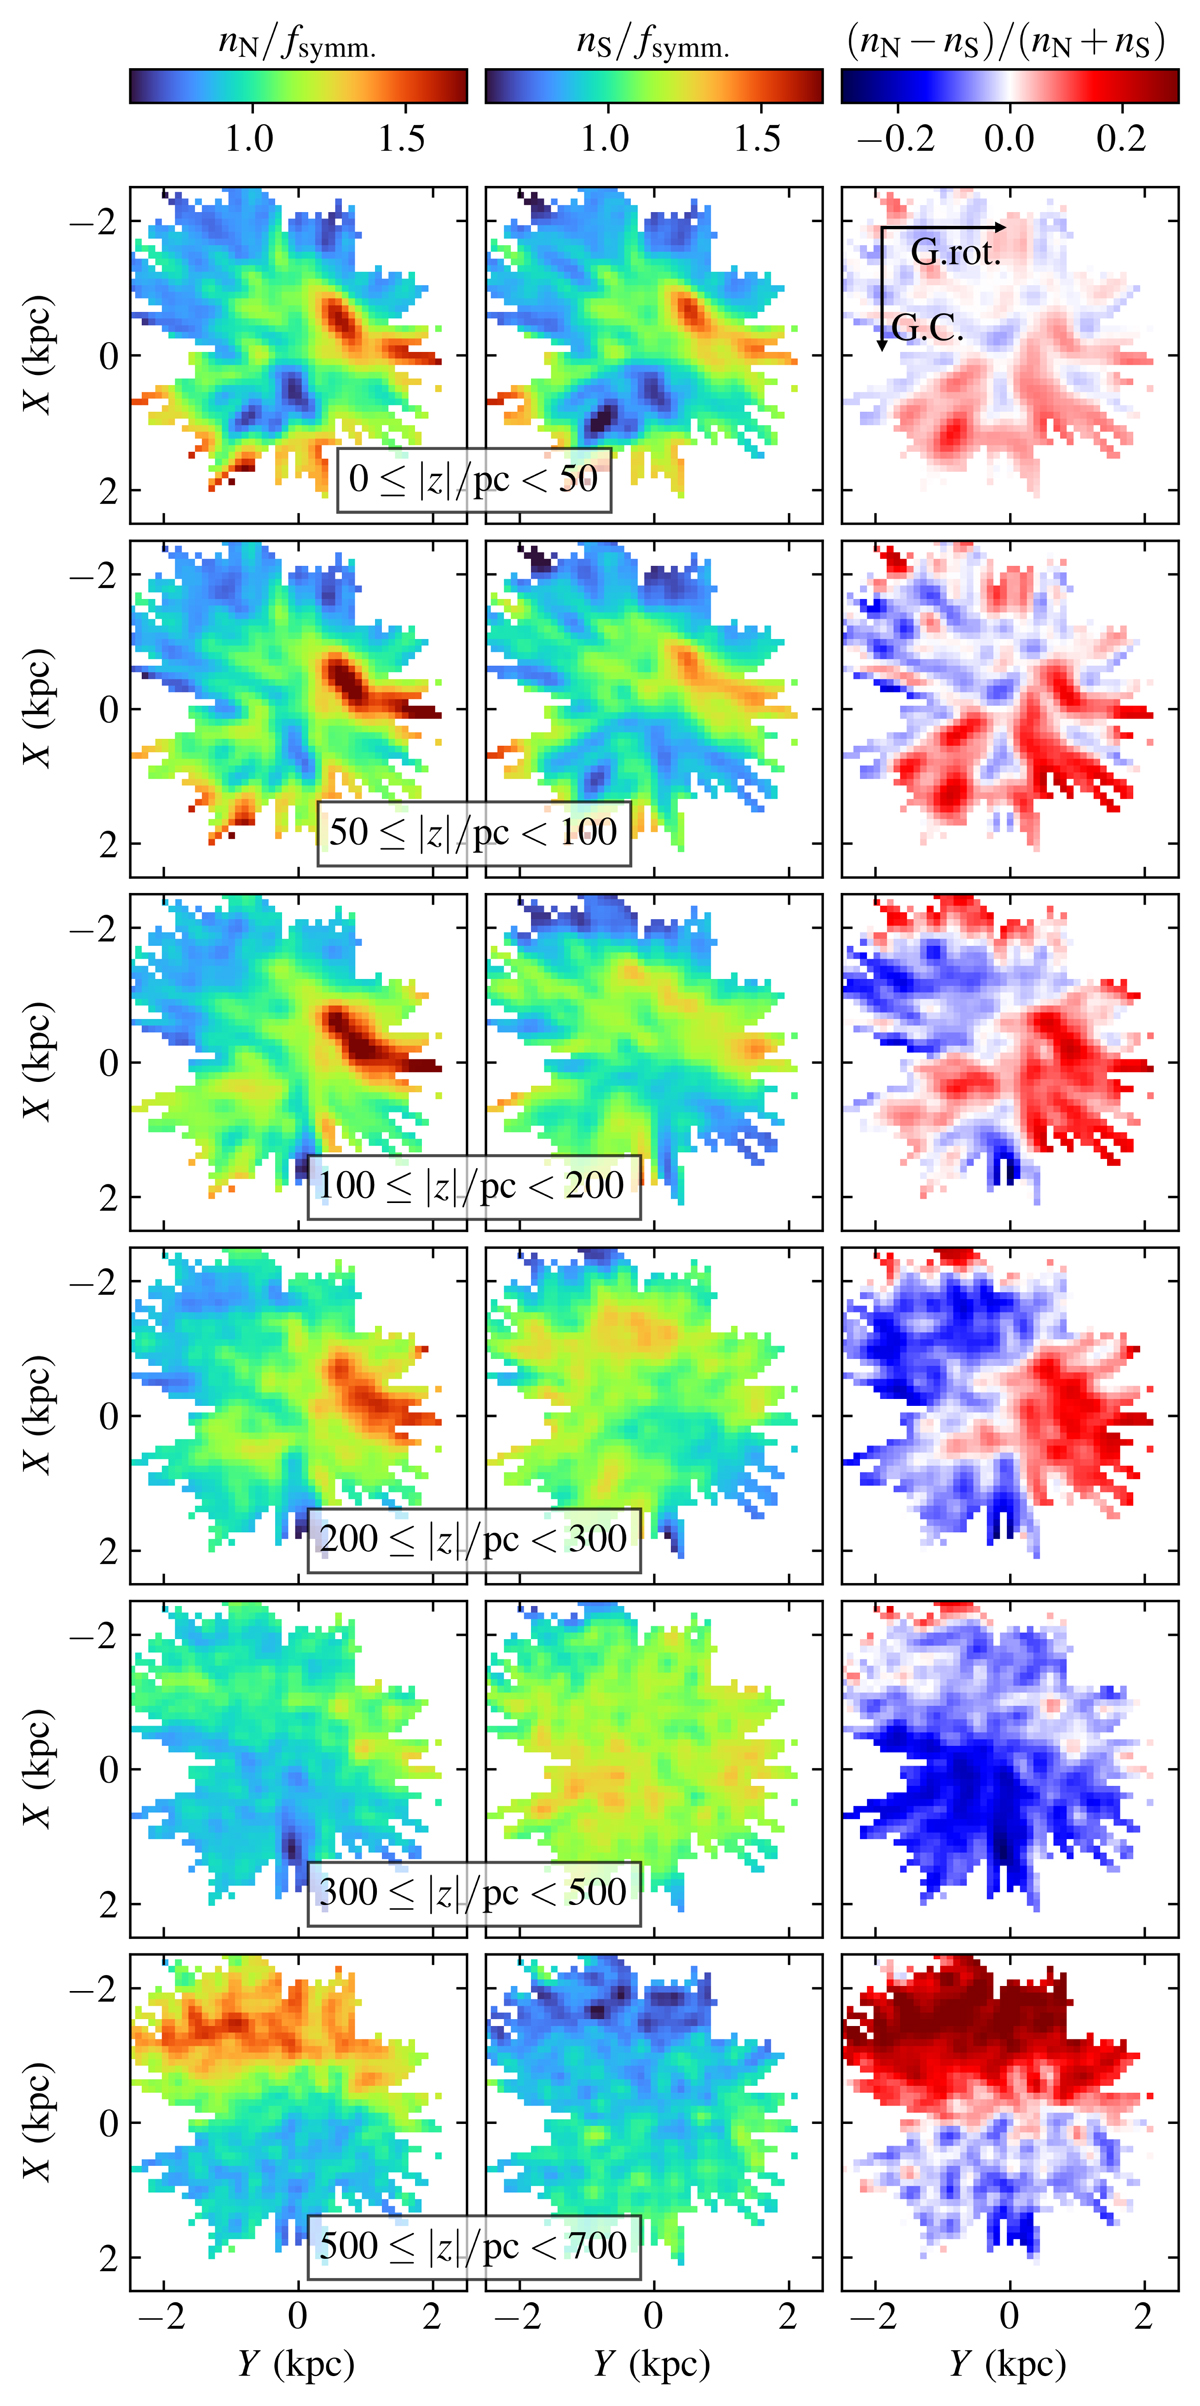
Stellar number density variations in the (X, Y)-plane of the data sample with 2 < MG ≤ 3, for different bins in height. The left (middle) column shows the density variations north (south) of the mid-plane as the ratio of the GP and symmetric analytic fit (as described in Sects. 3.3 and 3.4, respectively). The right column shows the asymmetries between the north and south of the GP fits, where each row corresponds to a specific range in height with respect to the mid-plane location when fitting fsymm.. The arrows in the top right panel show the directions of the Galactic centre and Galactic rotation. The axes ranges are shared between all panels.
Current usage metrics show cumulative count of Article Views (full-text article views including HTML views, PDF and ePub downloads, according to the available data) and Abstracts Views on Vision4Press platform.
Data correspond to usage on the plateform after 2015. The current usage metrics is available 48-96 hours after online publication and is updated daily on week days.
Initial download of the metrics may take a while.