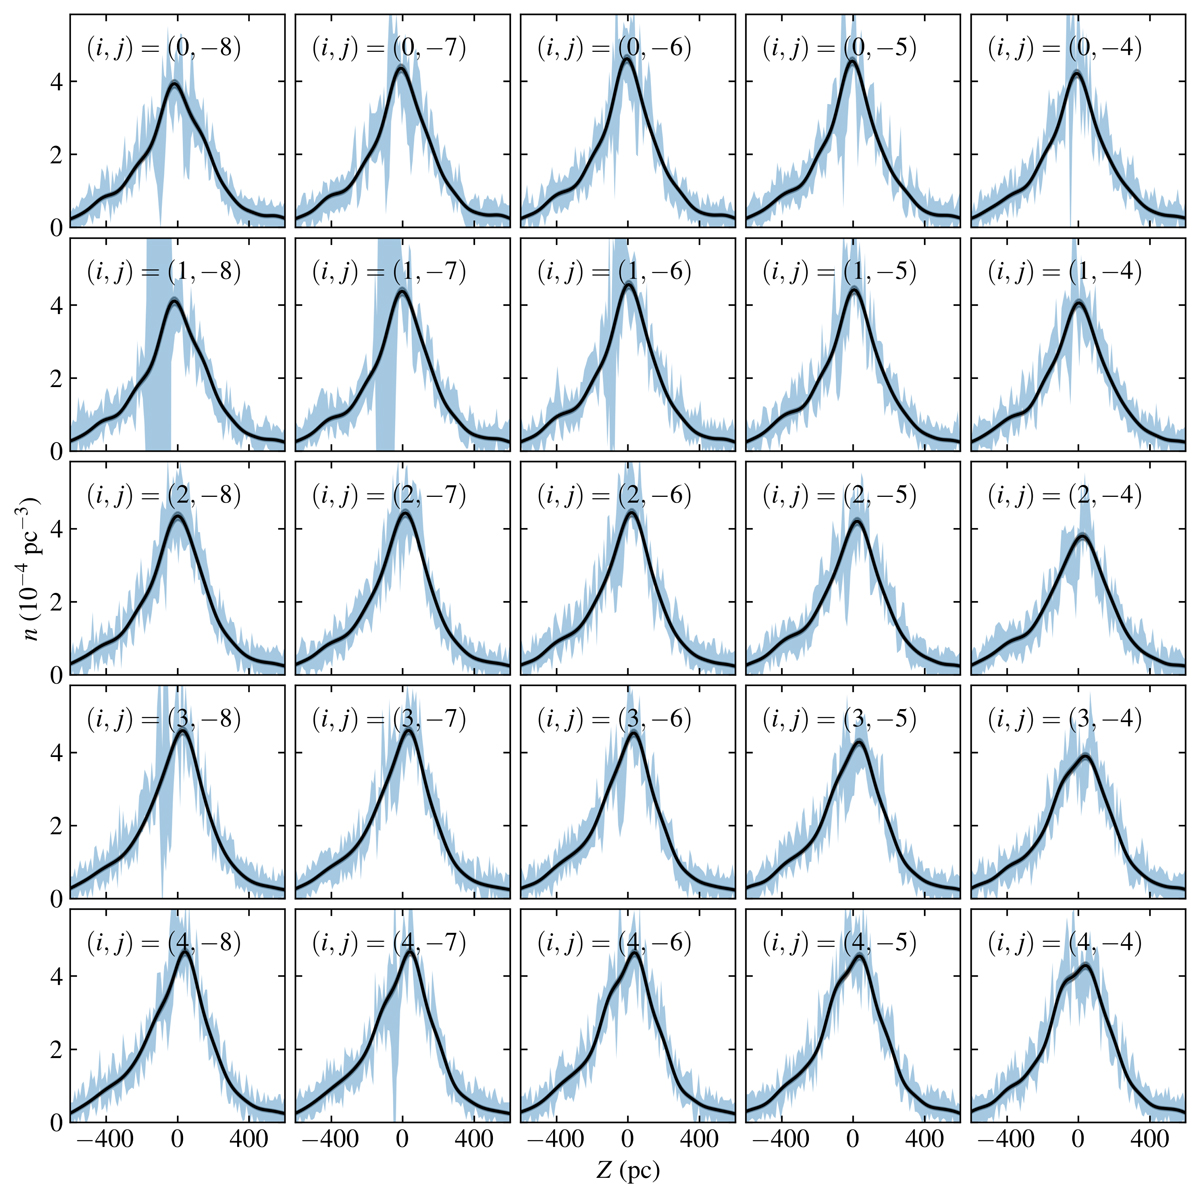
Fig. 4.
Download original image
GP fit for data sample with absolute magnitude cuts 2 < MG ≤ 3. Each panel corresponds to a 100-by-100 pc area cell in the (X, Y)-plane, labelled by indices i and j according to Eq. (6), thus centred on (X, Y) = (200, −600) pc. The horizontal and vertical axes show height with respect to the Sun and the normalised stellar number count as defined in Eq. (8). The solid lines correspond to the GP fits, with a smooth shaded region signifying its dispersion (mostly too small to see by eye). The jagged shaded region corresponds to the 1σ band of the data number count. The axis ranges are the same for all panels.
Current usage metrics show cumulative count of Article Views (full-text article views including HTML views, PDF and ePub downloads, according to the available data) and Abstracts Views on Vision4Press platform.
Data correspond to usage on the plateform after 2015. The current usage metrics is available 48-96 hours after online publication and is updated daily on week days.
Initial download of the metrics may take a while.