Fig. 11.
Download original image
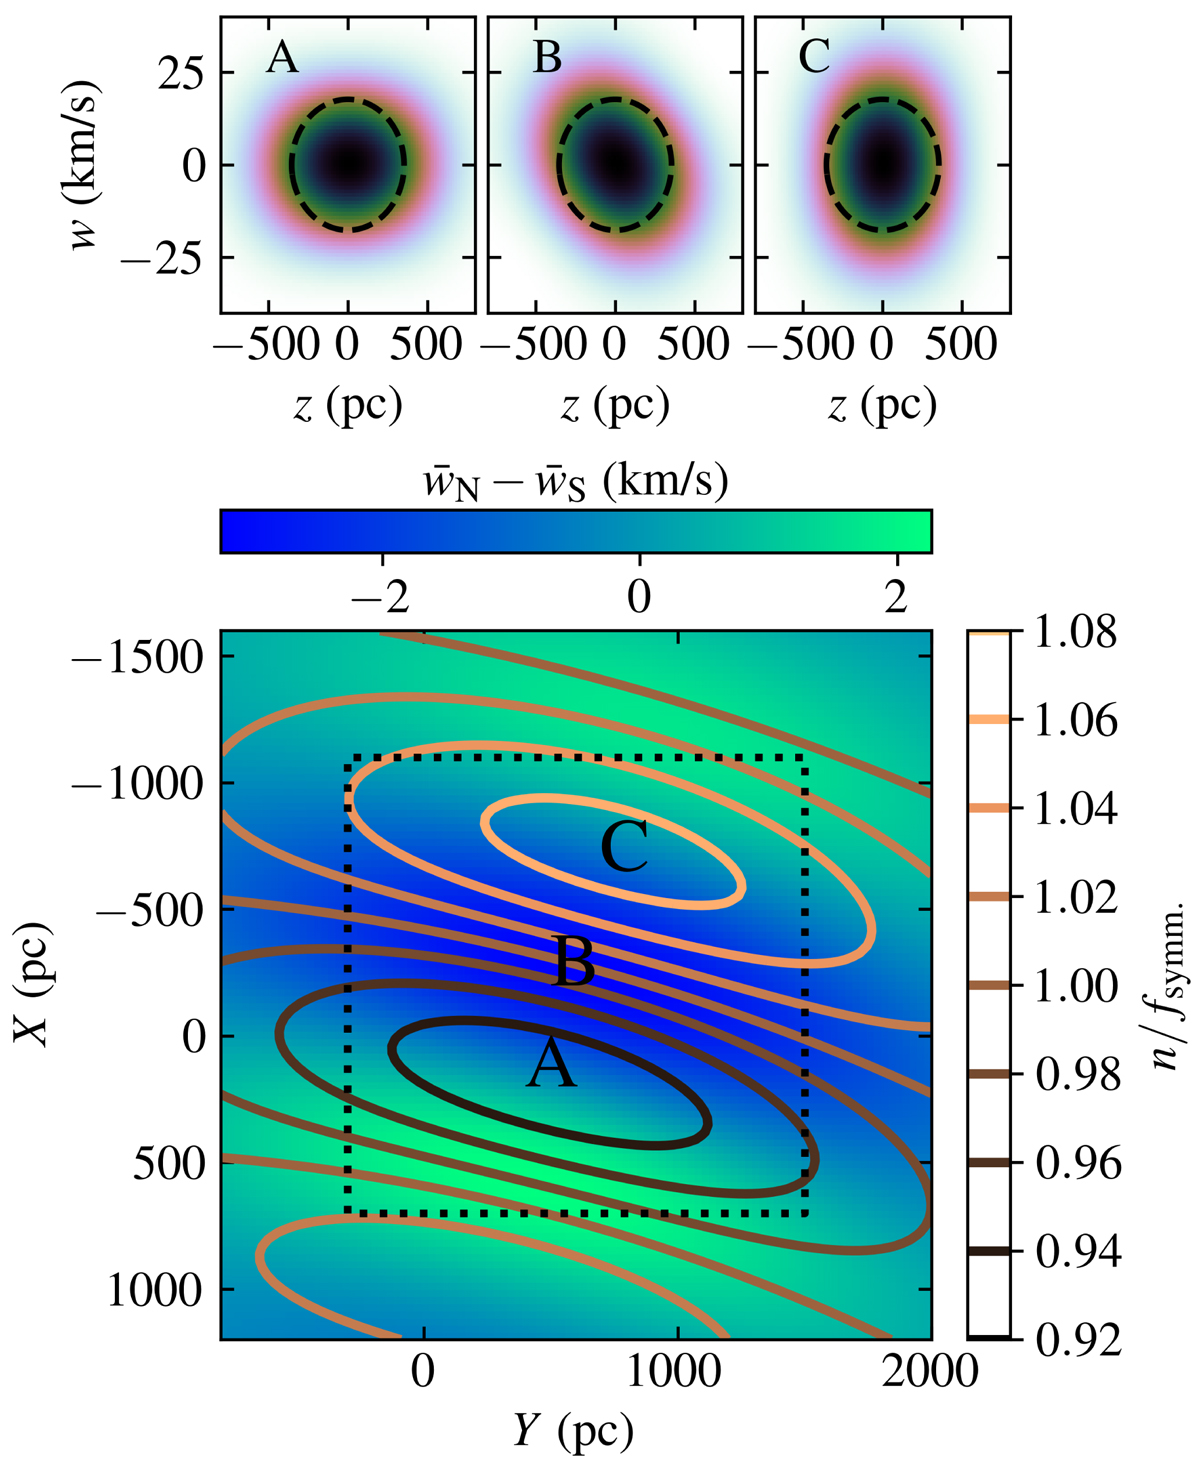
Toy model perturbations to the disk. The bottom panel shows n and ![]() for |z|< 300 pc and is analogous to Figs. 9 and 10. The dotted line corresponds to the disk area covered in Fig. 9. In the top three panels, we show the number counts in the (z, w)-plane at the points A, B, and C that are highlighted in the lower panel. In order to facilitate a comparison between them, an iso-energy contour for the unperturbed disk is shown as a dashed line.
for |z|< 300 pc and is analogous to Figs. 9 and 10. The dotted line corresponds to the disk area covered in Fig. 9. In the top three panels, we show the number counts in the (z, w)-plane at the points A, B, and C that are highlighted in the lower panel. In order to facilitate a comparison between them, an iso-energy contour for the unperturbed disk is shown as a dashed line.
Current usage metrics show cumulative count of Article Views (full-text article views including HTML views, PDF and ePub downloads, according to the available data) and Abstracts Views on Vision4Press platform.
Data correspond to usage on the plateform after 2015. The current usage metrics is available 48-96 hours after online publication and is updated daily on week days.
Initial download of the metrics may take a while.