Fig. 7
Download original image
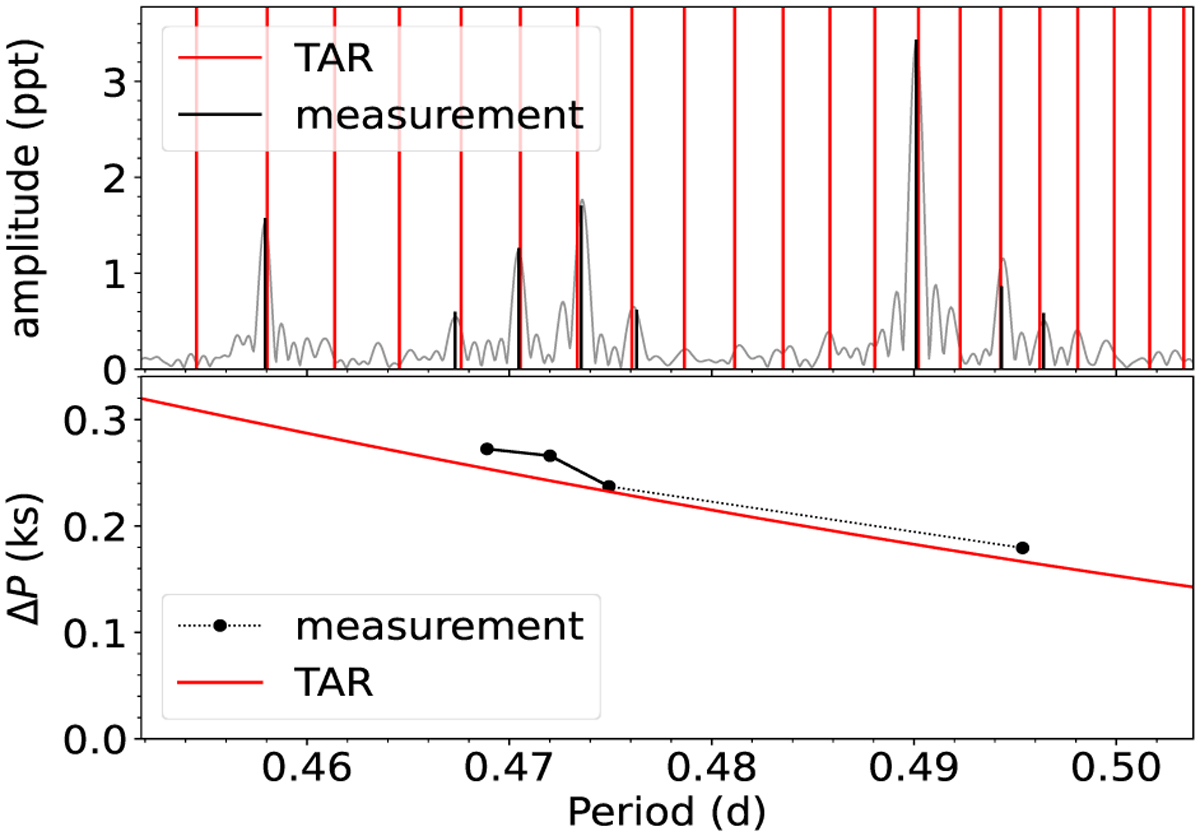
Best TAR model for the mode with k = 0 and m = 1 in TIC 381950897. Top: Lomb-Scargle periodogram (grey curve), detected periods (vertical black lines), and the TAR fit (vertical red lines). Bottom: Period spacings of both the TAR fit (red curve) and the detected periods (black circles). Period spacings of missing modes are omitted in the bottom panel. The dotted line connects periods spacings that stretch across missing modes. The units of the vertical axis AP are kiloseconds (ks) or 103 s.
Current usage metrics show cumulative count of Article Views (full-text article views including HTML views, PDF and ePub downloads, according to the available data) and Abstracts Views on Vision4Press platform.
Data correspond to usage on the plateform after 2015. The current usage metrics is available 48-96 hours after online publication and is updated daily on week days.
Initial download of the metrics may take a while.