Fig. 5
Download original image
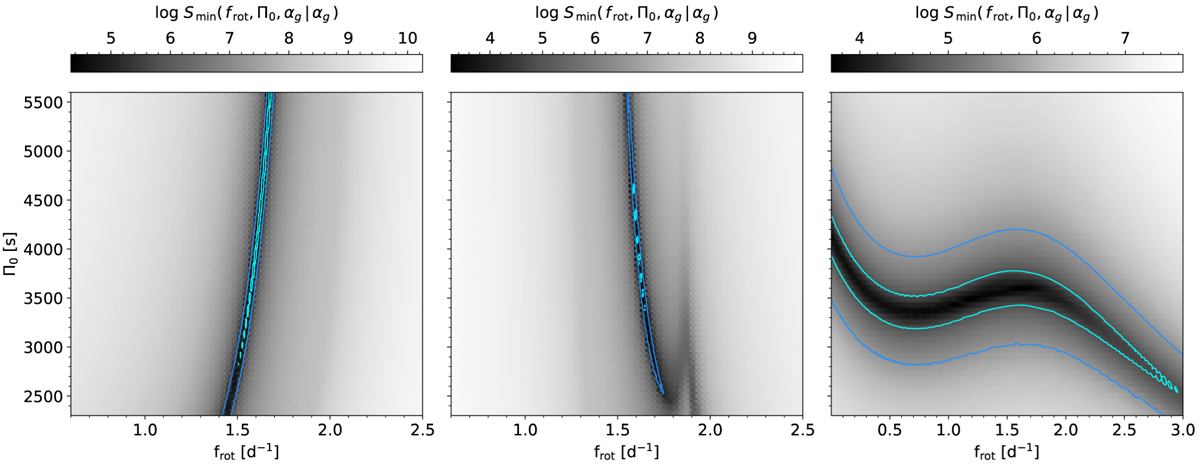
Cost function evaluated for the parameter ranges for the internal rotation and buoyancy travel time. Each panel shows a typical correlation between frot and ∏0. Left: Main pattern in TIC 381950897 with mode identification (0,1). Middle: Secondary pattern in TIC 381950897 with mode identification (−2, −1). Right: Pattern of TIC 293221812 with mode identification (0, −1). In each panel, the blue contour lines indicates S = 100 Smin while the cyan lines indicate S = 10 Smin.
Current usage metrics show cumulative count of Article Views (full-text article views including HTML views, PDF and ePub downloads, according to the available data) and Abstracts Views on Vision4Press platform.
Data correspond to usage on the plateform after 2015. The current usage metrics is available 48-96 hours after online publication and is updated daily on week days.
Initial download of the metrics may take a while.