Open Access
Fig. 4
Download original image
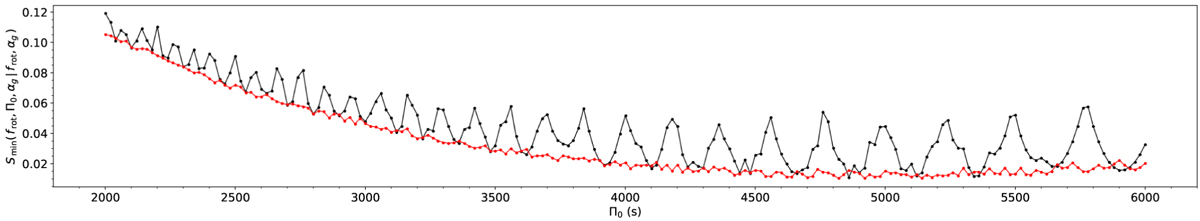
Effect of the resolution of frot in the parameter space on the determination of ∏0 for TIC 381950897. The black and red curves represent the cost function evaluated on the sparse and the dense parameter space indicated in Table 1, respectively.
Current usage metrics show cumulative count of Article Views (full-text article views including HTML views, PDF and ePub downloads, according to the available data) and Abstracts Views on Vision4Press platform.
Data correspond to usage on the plateform after 2015. The current usage metrics is available 48-96 hours after online publication and is updated daily on week days.
Initial download of the metrics may take a while.