Open Access
Fig. 3
Download original image
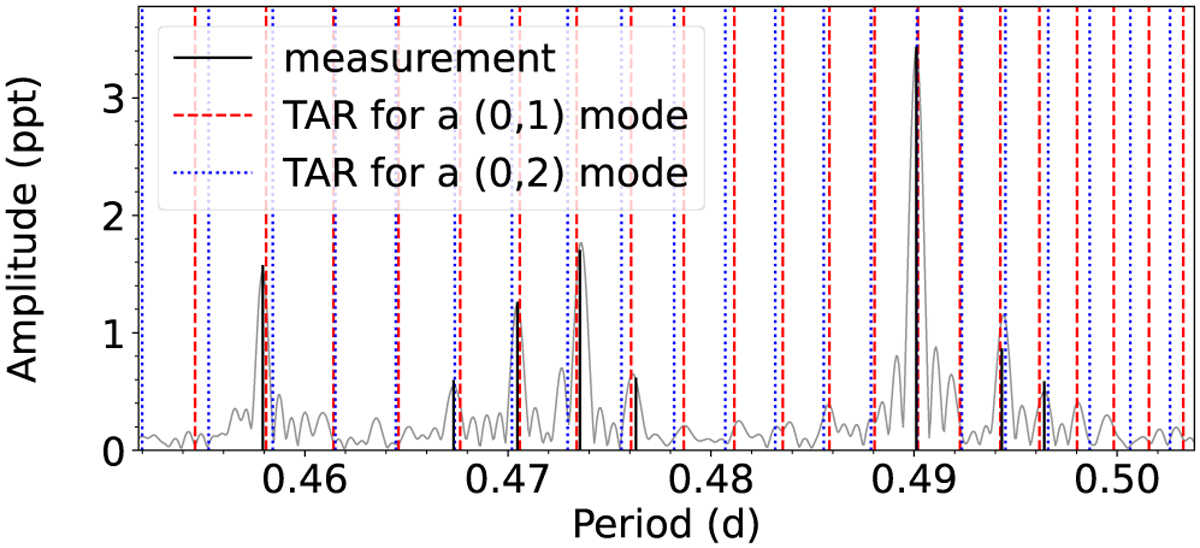
Traditional approximation of rotation solution for the first and second most plausible pulsation mode identifications, that is, (0, 1) and (0, 2), resulting from the main detected g-mode pattern of TIC 381950897 from the distribution in Fig. 1. The grey curve is the Lomb-Scargle periodogram.
Current usage metrics show cumulative count of Article Views (full-text article views including HTML views, PDF and ePub downloads, according to the available data) and Abstracts Views on Vision4Press platform.
Data correspond to usage on the plateform after 2015. The current usage metrics is available 48-96 hours after online publication and is updated daily on week days.
Initial download of the metrics may take a while.