Fig. 14
Download original image
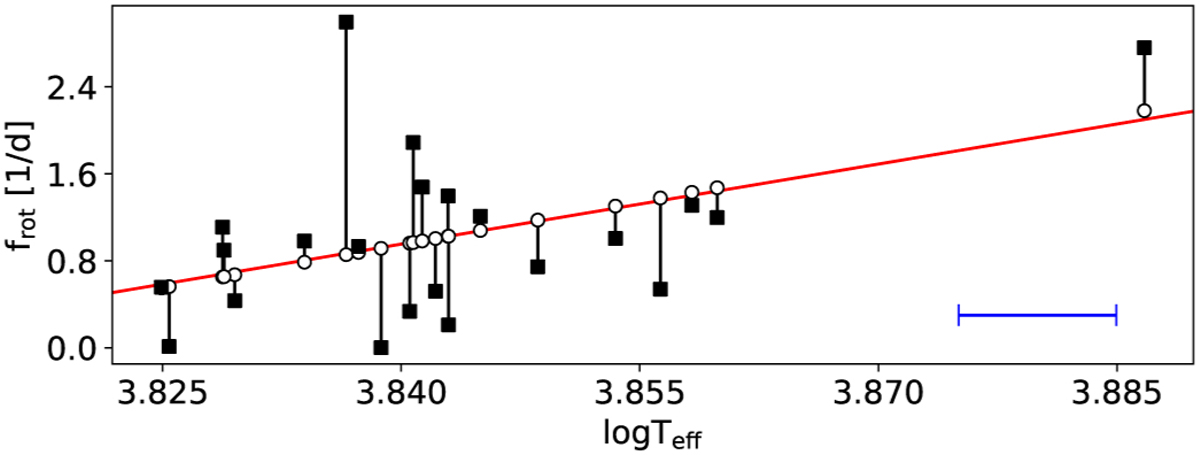
Multi-variate linear regression for the internal rotation. The squares are the observations and the circles are the modelled values. The corresponding values are connected with a black line. The red line is the model listed in Table 2. The typical uncertainty of log Teff is shown in blue in the bottom right corner. Uncertainties of frot are smaller than the symbol sizes.
Current usage metrics show cumulative count of Article Views (full-text article views including HTML views, PDF and ePub downloads, according to the available data) and Abstracts Views on Vision4Press platform.
Data correspond to usage on the plateform after 2015. The current usage metrics is available 48-96 hours after online publication and is updated daily on week days.
Initial download of the metrics may take a while.