Fig. 1.
Download original image
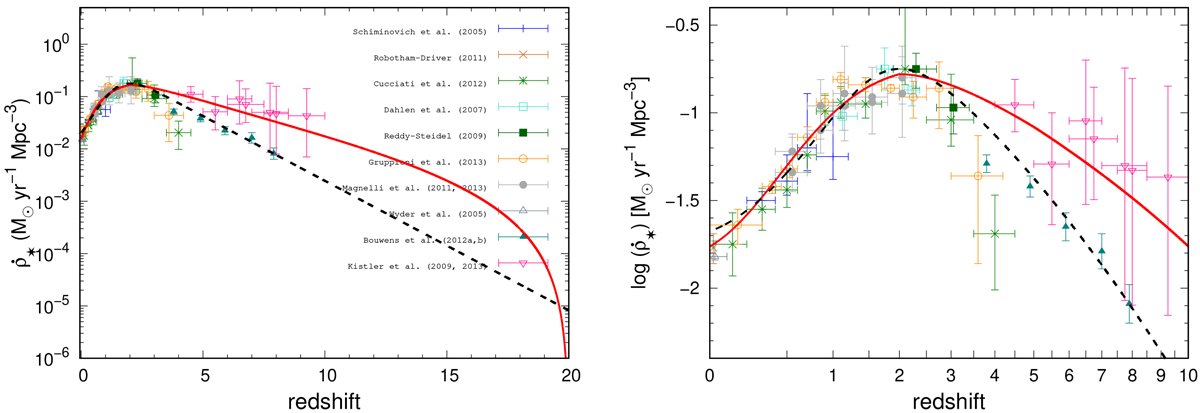
Solution for ![]() as derived in this work (red line) and, using black dashed line, the CSFR used by Vangioni et al. (2018) plotted for comparison. Left: evolution of the CSFR from the local Universe to z = 20. Right: same as for the left panel, but zooming into 0 ≤ z ≤ 10, allowing for a better visualization of the two CSFRs within the range of the available observational data. Data used in this figure: IR (Magnelli et al. 2011, 2013 – dark gray filled circles; Gruppioni et al. 2013 – dark orange open circles); UV (Wyder et al. 2005 – slate gray open triangle; Schiminovich et al. 2005 – blue crosses; Dahlen et al. 2007 – turquoise open squares; Reddy & Steidel 2009 – dark green filled squares; Robotham & Driver 2011 – chocolate cross; Cucciati et al. 2012 – green stars; Bouwens et al. 2012a, 2012b – teal filled triangles); and GRB (Kistler et al. 2009 – deep pink open triangles).
as derived in this work (red line) and, using black dashed line, the CSFR used by Vangioni et al. (2018) plotted for comparison. Left: evolution of the CSFR from the local Universe to z = 20. Right: same as for the left panel, but zooming into 0 ≤ z ≤ 10, allowing for a better visualization of the two CSFRs within the range of the available observational data. Data used in this figure: IR (Magnelli et al. 2011, 2013 – dark gray filled circles; Gruppioni et al. 2013 – dark orange open circles); UV (Wyder et al. 2005 – slate gray open triangle; Schiminovich et al. 2005 – blue crosses; Dahlen et al. 2007 – turquoise open squares; Reddy & Steidel 2009 – dark green filled squares; Robotham & Driver 2011 – chocolate cross; Cucciati et al. 2012 – green stars; Bouwens et al. 2012a, 2012b – teal filled triangles); and GRB (Kistler et al. 2009 – deep pink open triangles).
Current usage metrics show cumulative count of Article Views (full-text article views including HTML views, PDF and ePub downloads, according to the available data) and Abstracts Views on Vision4Press platform.
Data correspond to usage on the plateform after 2015. The current usage metrics is available 48-96 hours after online publication and is updated daily on week days.
Initial download of the metrics may take a while.