Open Access
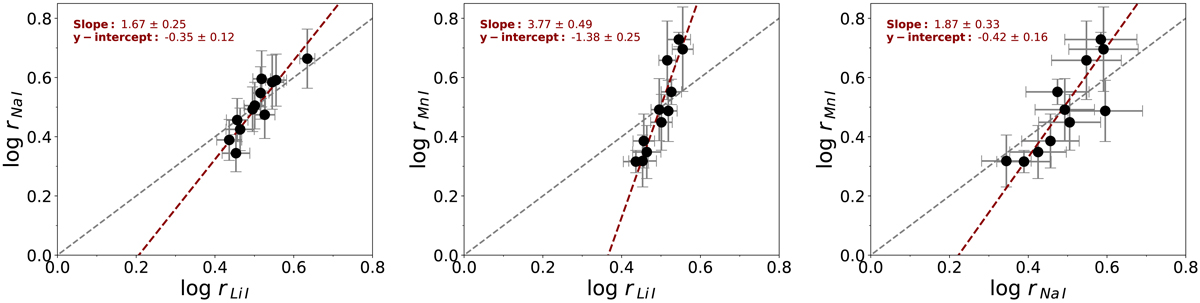
Fig. 9.
Download original image
Log plots of the veiling measured in the metal lines of Li I 6707 Å, Na I 5688 Å and Mn I 6021 Å in comparison with each other. These plots allow us to visualise how the veiling can vary from one line species to another and that this is indicative of line emission veiling contributing to the total veiling measured in each.
Current usage metrics show cumulative count of Article Views (full-text article views including HTML views, PDF and ePub downloads, according to the available data) and Abstracts Views on Vision4Press platform.
Data correspond to usage on the plateform after 2015. The current usage metrics is available 48-96 hours after online publication and is updated daily on week days.
Initial download of the metrics may take a while.