Fig. 7.
Download original image
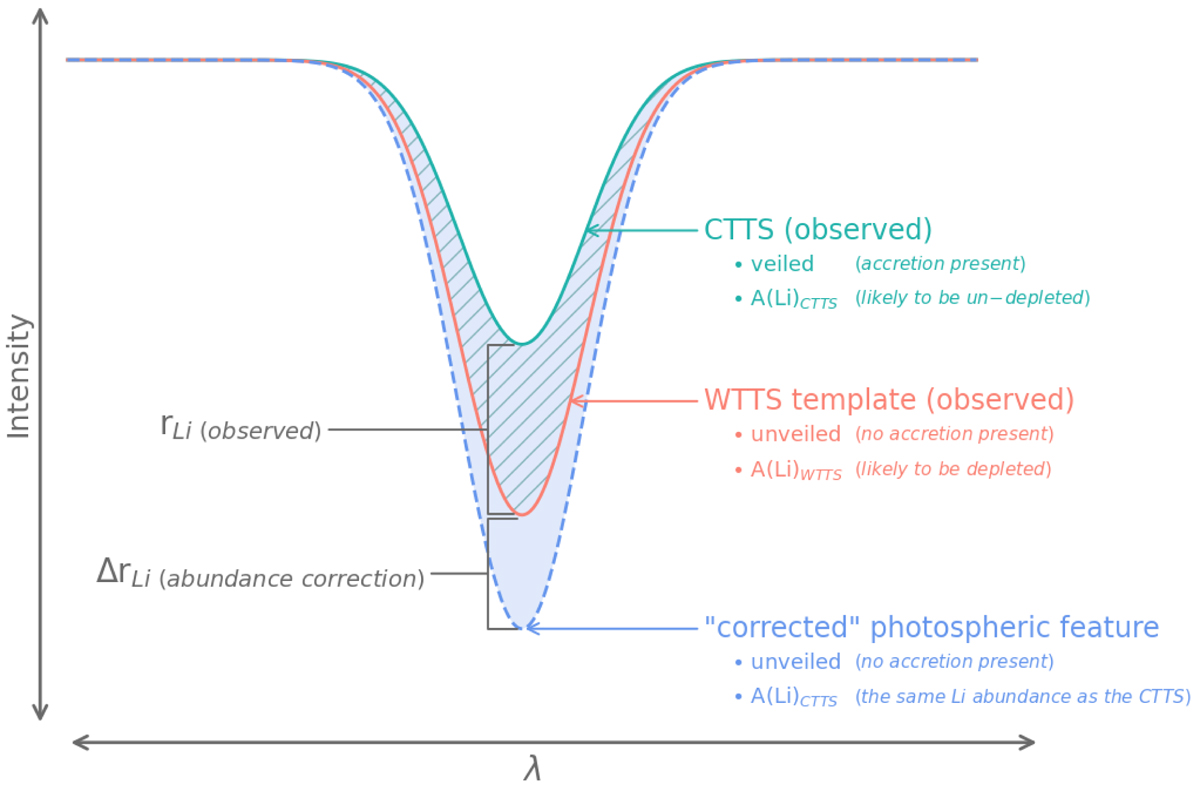
Diagram showing the difference in an observed CTTS (teal) Li I 6707 Å line and that of a WTTS (orange). The deepest absorption feature (dashed light blue) represents a spectrum with no veiling and the same abundance of Li I 6707 Å as the CTTS. The hatched region represents the difference in absorption depth between the CTTS and WTTS. The shaded region represents the difference in absorption depth between the CTTS and the unveiled CTTS spectrum.
Current usage metrics show cumulative count of Article Views (full-text article views including HTML views, PDF and ePub downloads, according to the available data) and Abstracts Views on Vision4Press platform.
Data correspond to usage on the plateform after 2015. The current usage metrics is available 48-96 hours after online publication and is updated daily on week days.
Initial download of the metrics may take a while.