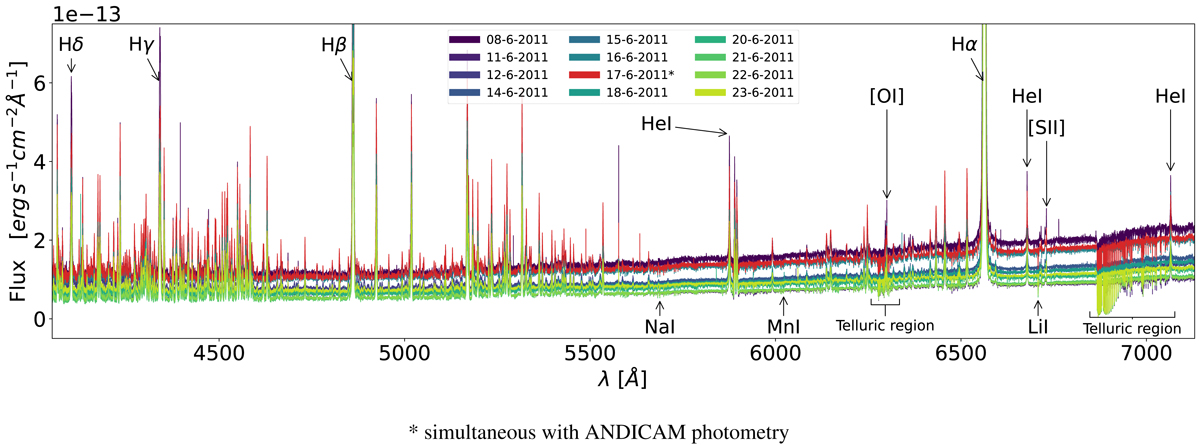
Fig. 3.
Download original image
Flux calibrated spectra from the 12 epochs taken with ESPaDOnS across the optical regime (4000 − 7100 Å). Notable emission and absorption lines discussed in this study are identified with their species name. Regions highly contaminated by telluric emission are also indicated. The spectrum in black (17-06-2011) represents the night of observations that we calibrated with simultaneous photometry. The other 11 nights were flux calibrated as described in Sect. 2.2.
Current usage metrics show cumulative count of Article Views (full-text article views including HTML views, PDF and ePub downloads, according to the available data) and Abstracts Views on Vision4Press platform.
Data correspond to usage on the plateform after 2015. The current usage metrics is available 48-96 hours after online publication and is updated daily on week days.
Initial download of the metrics may take a while.