Open Access
Fig. E.1.
Download original image
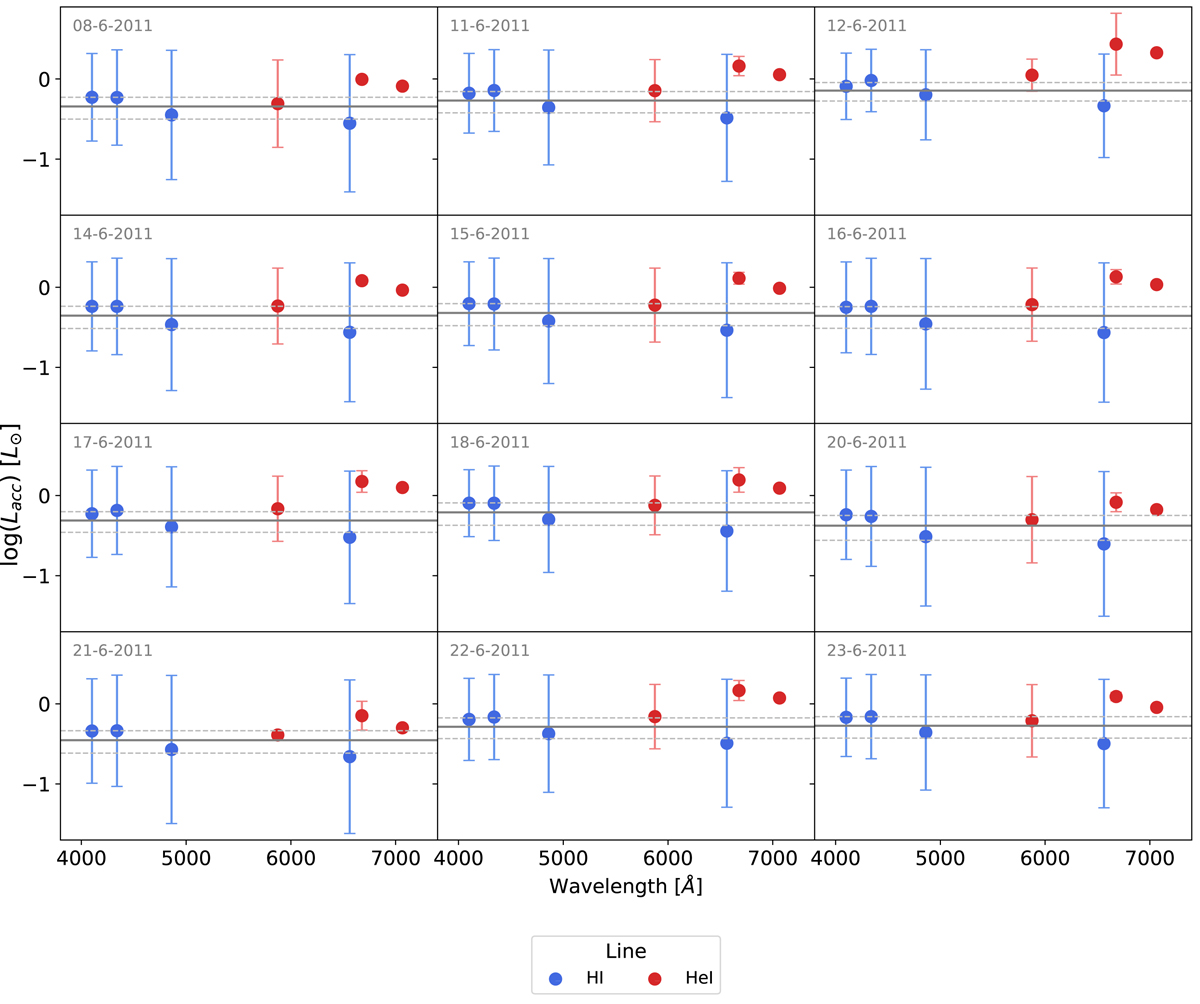
Plots searching for any possible wavelength dependence of the estimate of Lacc for each of the 12 epochs. None is found. The horizontal line represents the Lacc used as a result, which has been derived from an average of only the H I’s values for Lacc (blue dots). The He I (red dots) lines are also shown.
Current usage metrics show cumulative count of Article Views (full-text article views including HTML views, PDF and ePub downloads, according to the available data) and Abstracts Views on Vision4Press platform.
Data correspond to usage on the plateform after 2015. The current usage metrics is available 48-96 hours after online publication and is updated daily on week days.
Initial download of the metrics may take a while.