Open Access
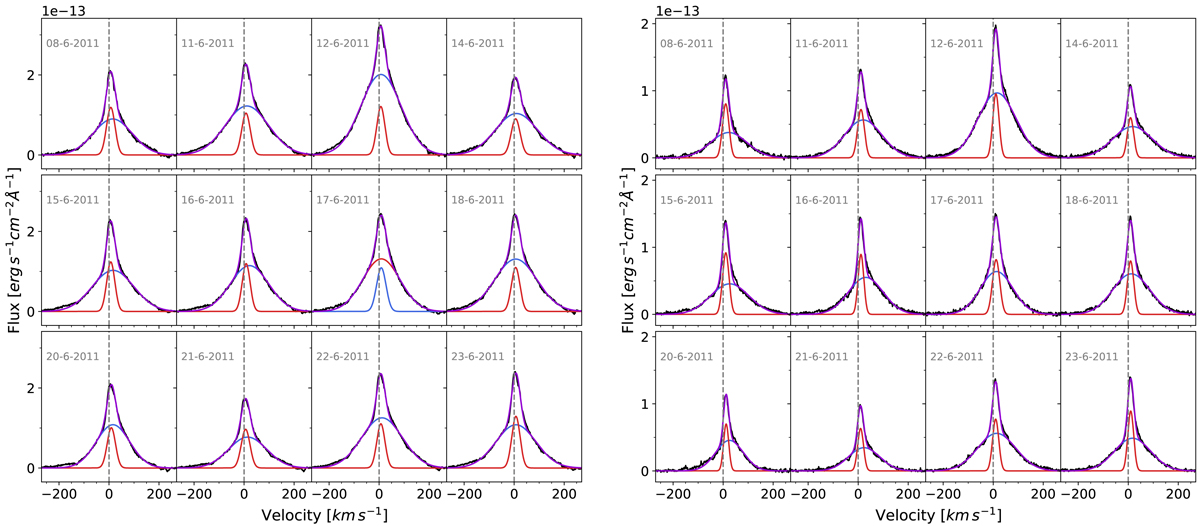
Fig. D.1.
Download original image
Gaussian decompositions of the He I 5875 Å (left-hand plots) and 6678 Å (right-hand plots) emission lines for each night of observations. The spectra are continuum-subtracted and flux calibrated.
Current usage metrics show cumulative count of Article Views (full-text article views including HTML views, PDF and ePub downloads, according to the available data) and Abstracts Views on Vision4Press platform.
Data correspond to usage on the plateform after 2015. The current usage metrics is available 48-96 hours after online publication and is updated daily on week days.
Initial download of the metrics may take a while.