Fig. 1.
Download original image
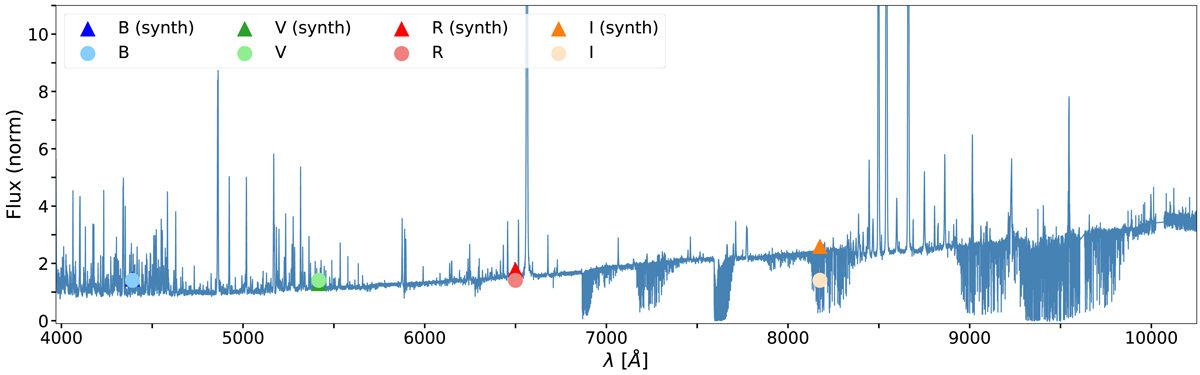
ESPaDOnS optical spectrum of RU Lup on the night of 17 June 2011. This spectrum is overlaid with the photometry measured from the ANDICAM observations of the same night. The circles represent the aperture photometry taken in the B, V, R and I bands and the triangles represent the synthetic photometry calculated by convolving the spectrum with the transmission response of ANDICAM in each band. For the B and V bands the triangles and circles are overlapping.
Current usage metrics show cumulative count of Article Views (full-text article views including HTML views, PDF and ePub downloads, according to the available data) and Abstracts Views on Vision4Press platform.
Data correspond to usage on the plateform after 2015. The current usage metrics is available 48-96 hours after online publication and is updated daily on week days.
Initial download of the metrics may take a while.