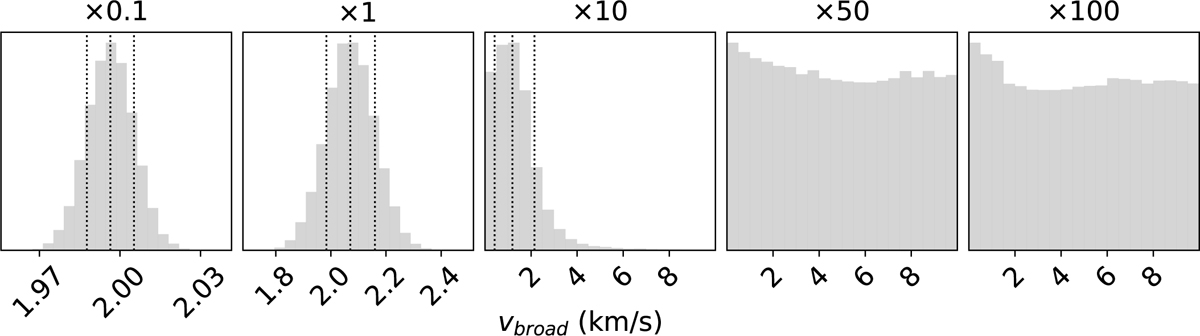
Fig. A.2
Download original image
Posterior distributions of vbroad from simulated data with different noise levels. The noise level corresponds to that of the observed spectra multiplied by the factor that is reported at the top of each panel. The simulated broadening of 2 km s−1 can be retrieved for noise levels up to ten times that of the simulated observation data. The median and 1σ percentiles of the distributions that retrieve the simulated line broadening are indicated by the dashed vertical lines.
Current usage metrics show cumulative count of Article Views (full-text article views including HTML views, PDF and ePub downloads, according to the available data) and Abstracts Views on Vision4Press platform.
Data correspond to usage on the plateform after 2015. The current usage metrics is available 48-96 hours after online publication and is updated daily on week days.
Initial download of the metrics may take a while.