Fig. 4.
Download original image
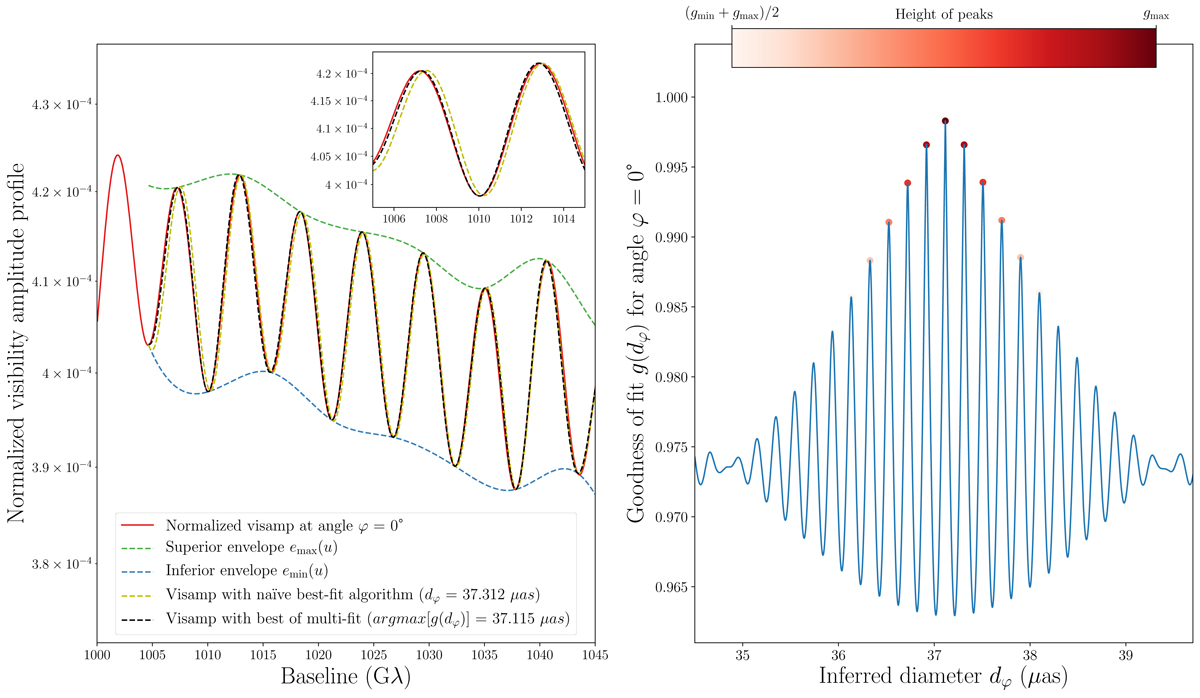
Example of a model requiring a multi-peak fitting technique. Left: fit comparison: naïvely fitting the model Vfit(u; d) (Eq. (33)) to the visamp profile |V(u)| (solid red curve) yields an excellent but suboptimal fit (dashed yellow curve), since a better one exists (dashed black curve). Right: goodness of fit g(dφ) as a function of fitting diameter (Eq. (36)). The absolute best-fit corresponds to the global maximum of g(dφ), while other local maxima correspond to good but subopitmal fits. These peaks are approximately periodic with a separation Δdφ ≈ 0.2 μas that exactly matches 1/uw, since our baseline window is at uw ∼ 1000 Gλ.
Current usage metrics show cumulative count of Article Views (full-text article views including HTML views, PDF and ePub downloads, according to the available data) and Abstracts Views on Vision4Press platform.
Data correspond to usage on the plateform after 2015. The current usage metrics is available 48-96 hours after online publication and is updated daily on week days.
Initial download of the metrics may take a while.