Fig. C.1.
Download original image
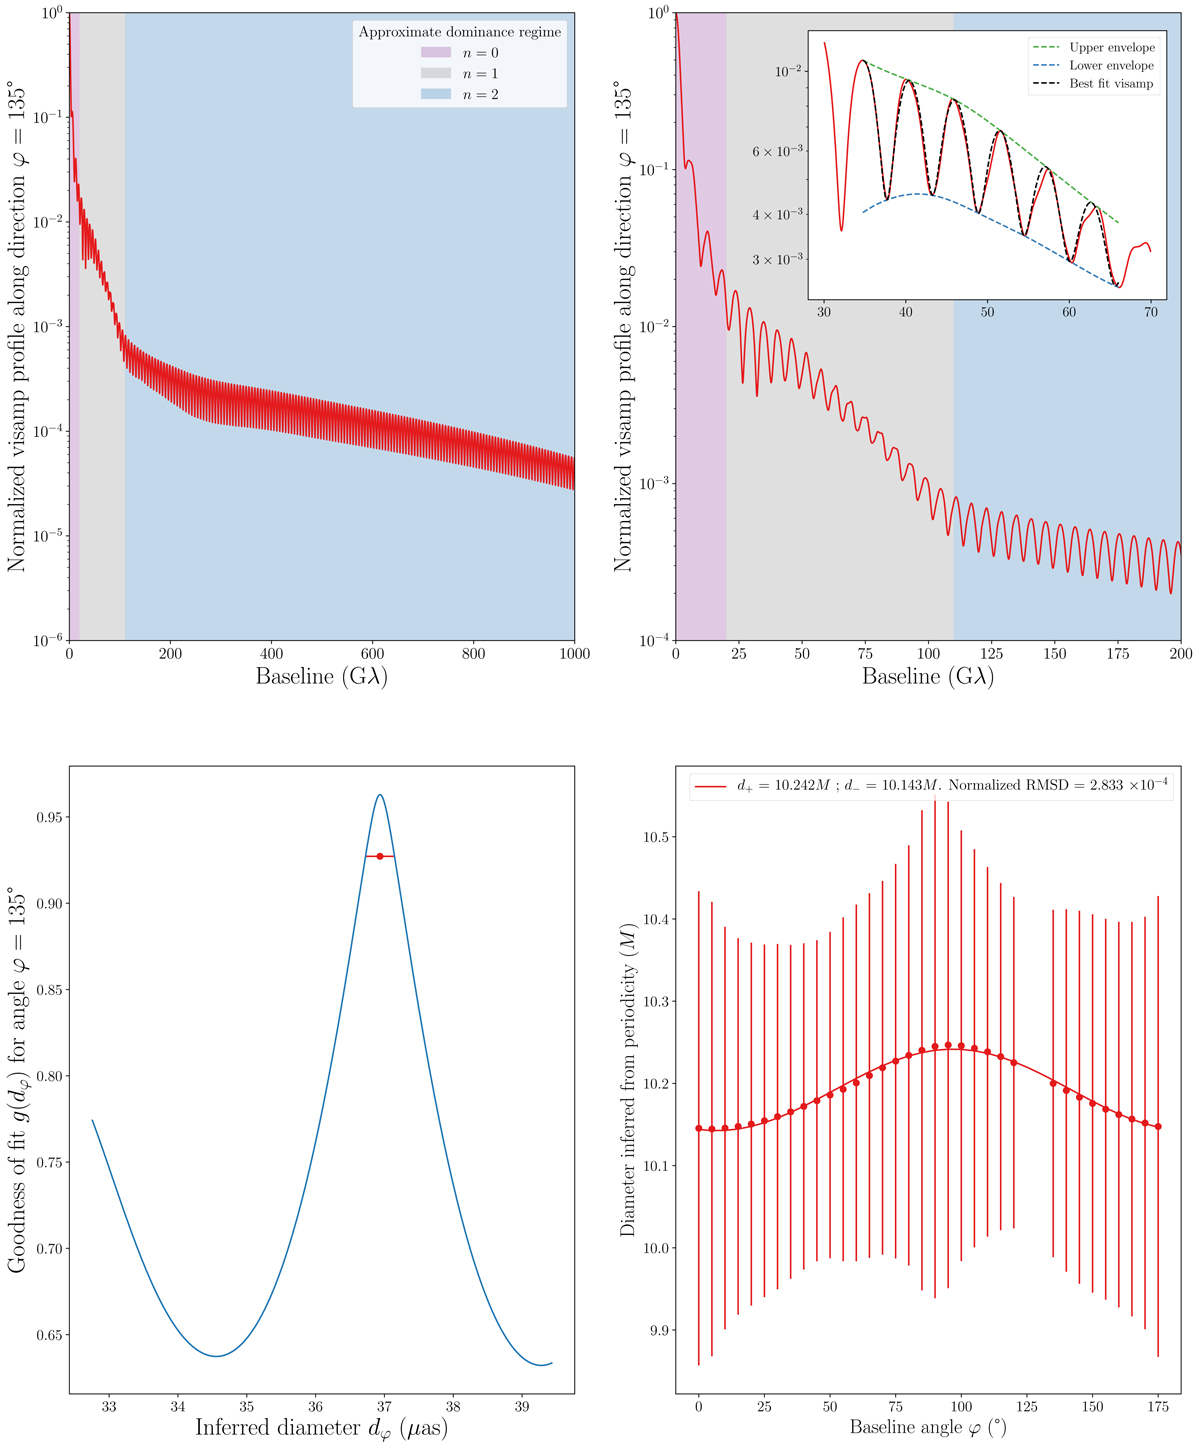
Kerr hypothesis test using the GLM method applied to the n = 1 subring. An image was simulated for a BH of spin a = 0.94 and inclination i = 17°, with equatorial emission profile parameters μ = r−, ![]() , σ = 0.5. (Upper left) Amplitude |V(u, φ)| of the visibility at φ = 135°, with baselines colored according to which subring dominates the signal (Sec. 2.7). (Upper Right) Visibility amplitude fit (with envelope) in the n = 1-dominated baseline window uw ∈ [30, 70] Gλ (Sec. 3). (Lower left) Goodness of fit (Eq. (36)) as a function of fitting diameter
, σ = 0.5. (Upper left) Amplitude |V(u, φ)| of the visibility at φ = 135°, with baselines colored according to which subring dominates the signal (Sec. 2.7). (Upper Right) Visibility amplitude fit (with envelope) in the n = 1-dominated baseline window uw ∈ [30, 70] Gλ (Sec. 3). (Lower left) Goodness of fit (Eq. (36)) as a function of fitting diameter ![]() . The dot corresponds to the diameter with maximal goodness of fit
. The dot corresponds to the diameter with maximal goodness of fit ![]() . The error bar includes nearby diameters such that RMSDu(dφ) ≤ 2 RMSDu,min, or equivalently
. The error bar includes nearby diameters such that RMSDu(dφ) ≤ 2 RMSDu,min, or equivalently ![]() . (Lower Right) Fitting
. (Lower Right) Fitting ![]() to a circlipse using the multi-fit method (Sec. 3.2.4), with the same prescription for the error bars. Angles φ = 125° and 130° were removed because the visamp fit in the chosen baseline window was too poor.
to a circlipse using the multi-fit method (Sec. 3.2.4), with the same prescription for the error bars. Angles φ = 125° and 130° were removed because the visamp fit in the chosen baseline window was too poor.
Current usage metrics show cumulative count of Article Views (full-text article views including HTML views, PDF and ePub downloads, according to the available data) and Abstracts Views on Vision4Press platform.
Data correspond to usage on the plateform after 2015. The current usage metrics is available 48-96 hours after online publication and is updated daily on week days.
Initial download of the metrics may take a while.