Open Access
Fig. 23
Download original image
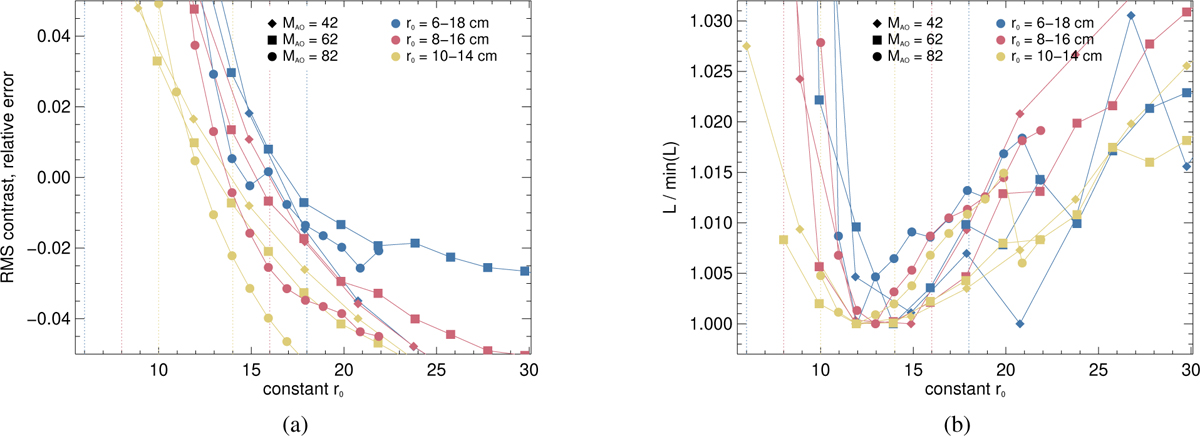
Results from using MFBD with FD and SD on the same data as in Fig. 20 but with a constant assumed r0. The vertical dotted lines represent the limits of the r0 intervals, (a) RMS contrast, relative error, (b) Converged error metric L, normalized to its minimum.
Current usage metrics show cumulative count of Article Views (full-text article views including HTML views, PDF and ePub downloads, according to the available data) and Abstracts Views on Vision4Press platform.
Data correspond to usage on the plateform after 2015. The current usage metrics is available 48-96 hours after online publication and is updated daily on week days.
Initial download of the metrics may take a while.