Open Access
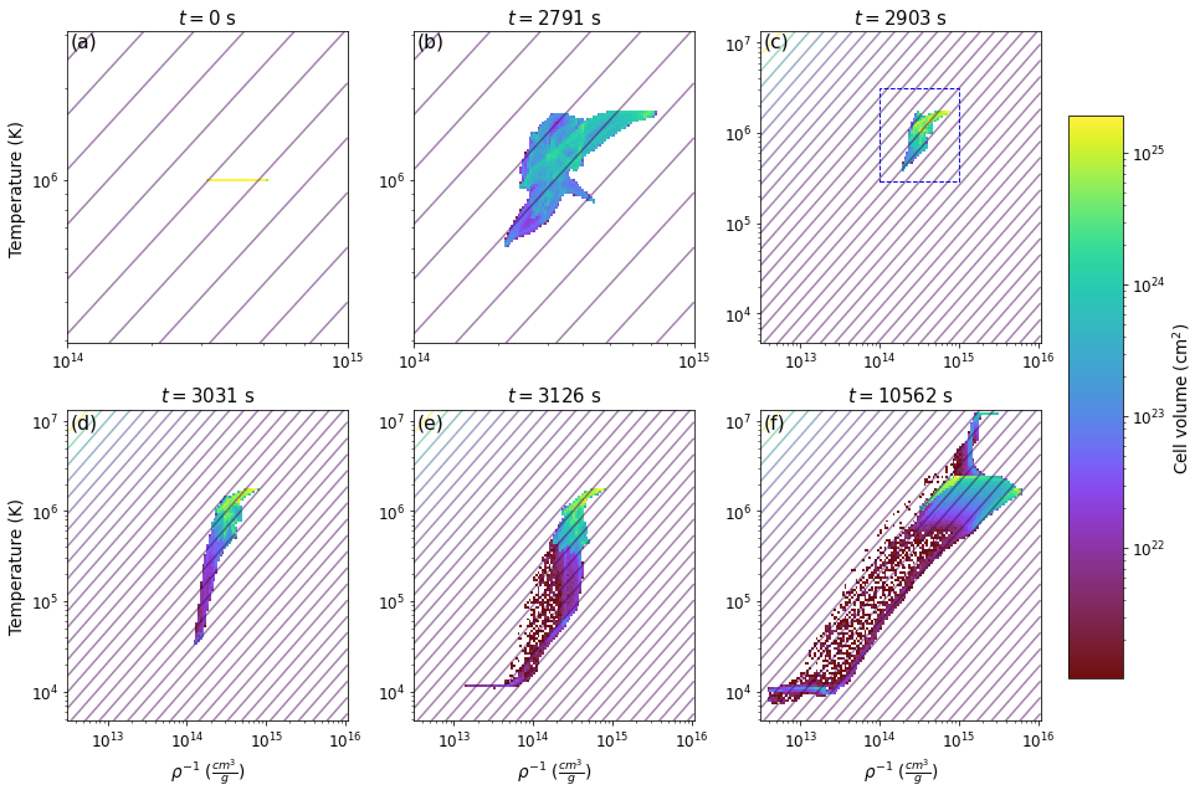
Fig. 11.
Download original image
Evolution in ρ−1 − T state space for model RE, with pressure isocontours diagonally. Distribution given in total cell volume. A movie of this figure is available with the online version of this manuscript.
Current usage metrics show cumulative count of Article Views (full-text article views including HTML views, PDF and ePub downloads, according to the available data) and Abstracts Views on Vision4Press platform.
Data correspond to usage on the plateform after 2015. The current usage metrics is available 48-96 hours after online publication and is updated daily on week days.
Initial download of the metrics may take a while.