Open Access
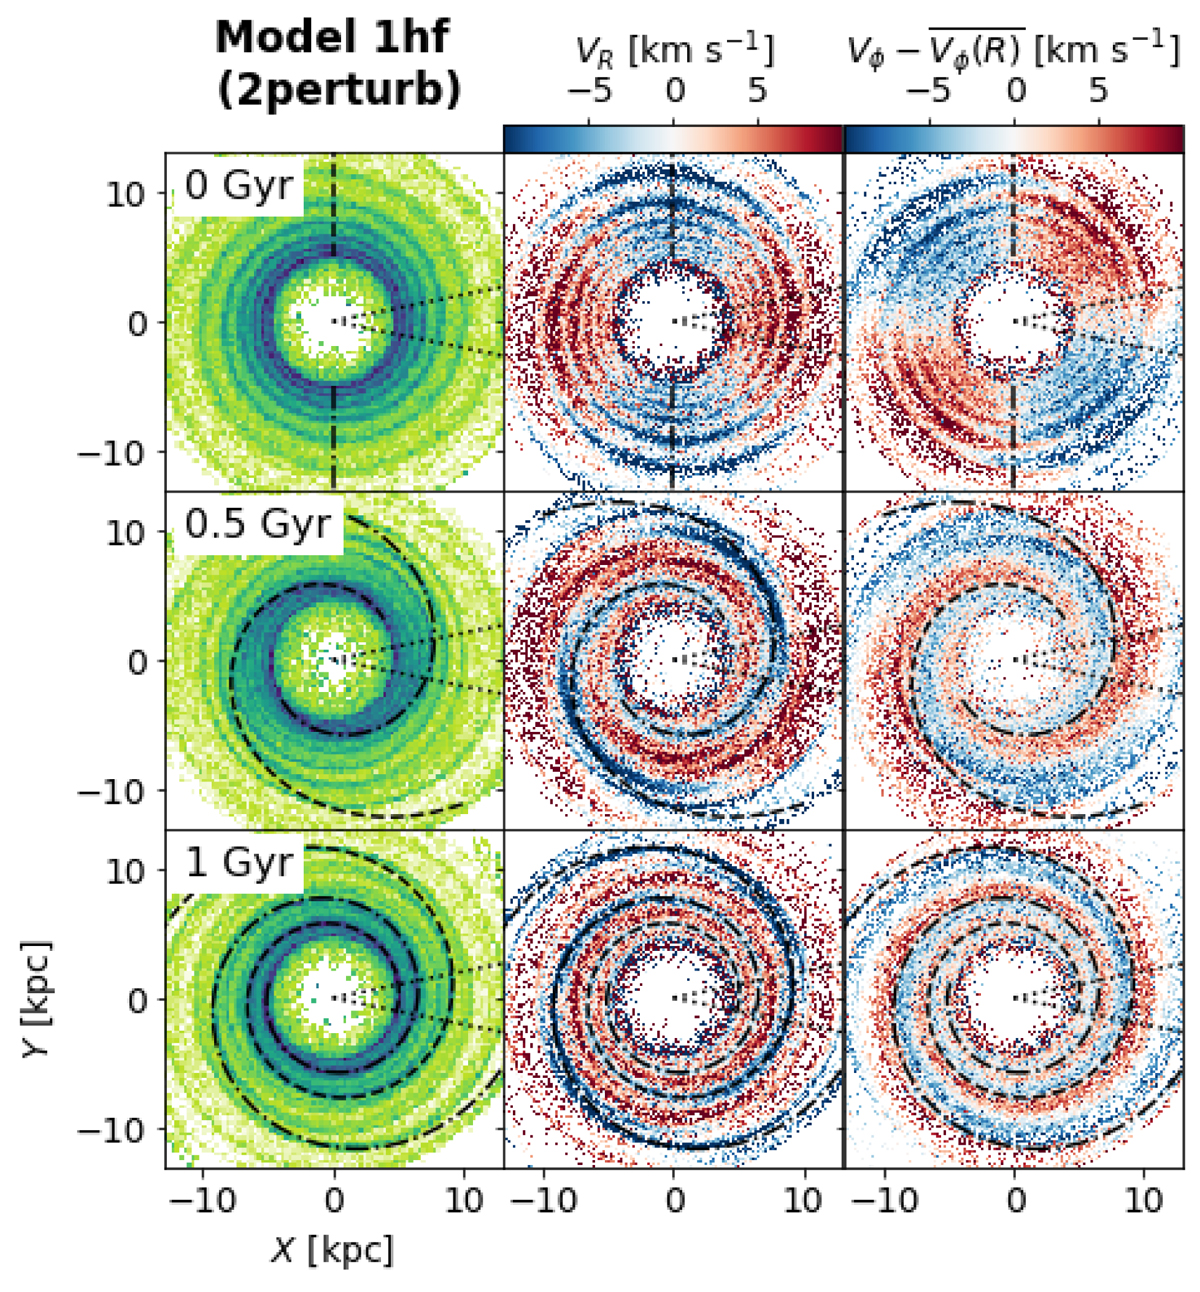
Fig. 9.
Download original image
Spiral arms of Model 1hf for two consecutive perturbations. The first perturbation starts at t = −2 Gyr and has ΔV1 = 10 km s−1, and the second starts at t = 0 and has ΔV2 = 15 km s−1. The plot has the same structure as Fig. 3 but fewer times are shown. The lines show the arms location consequence of the second impact.
Current usage metrics show cumulative count of Article Views (full-text article views including HTML views, PDF and ePub downloads, according to the available data) and Abstracts Views on Vision4Press platform.
Data correspond to usage on the plateform after 2015. The current usage metrics is available 48-96 hours after online publication and is updated daily on week days.
Initial download of the metrics may take a while.