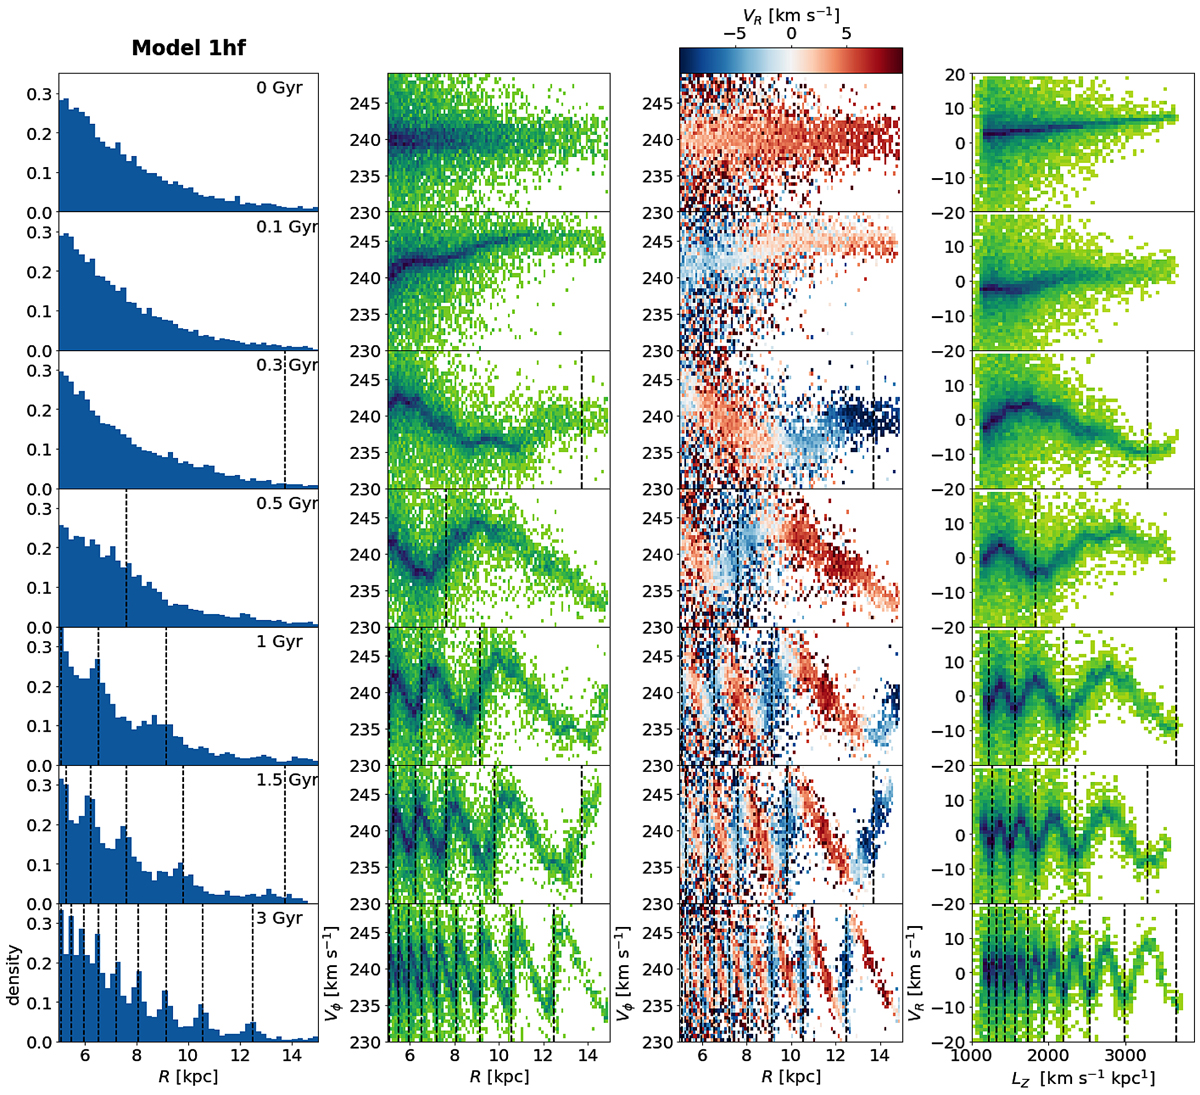
Fig. 6.
Download original image
Ridges and waves for Model 1hf. We show the time evolution between 0 and 3 Gyr (indicated in the first column) of the disc region at ϕ = π ± 0.2 rad (marked with dotted lines in Fig. 3). First column: a normalised density histogram of the radius of the particles R. Second and third columns: the R − Vϕ projection in density and coloured by mean VR, respectively. Fourth column: the particles in the LZ − VR projection. The vertical dashed lines in all panels indicate the prediction of the spiral arm locations following a winding rate of ![]() .
.
Current usage metrics show cumulative count of Article Views (full-text article views including HTML views, PDF and ePub downloads, according to the available data) and Abstracts Views on Vision4Press platform.
Data correspond to usage on the plateform after 2015. The current usage metrics is available 48-96 hours after online publication and is updated daily on week days.
Initial download of the metrics may take a while.