Fig. 3.
Download original image
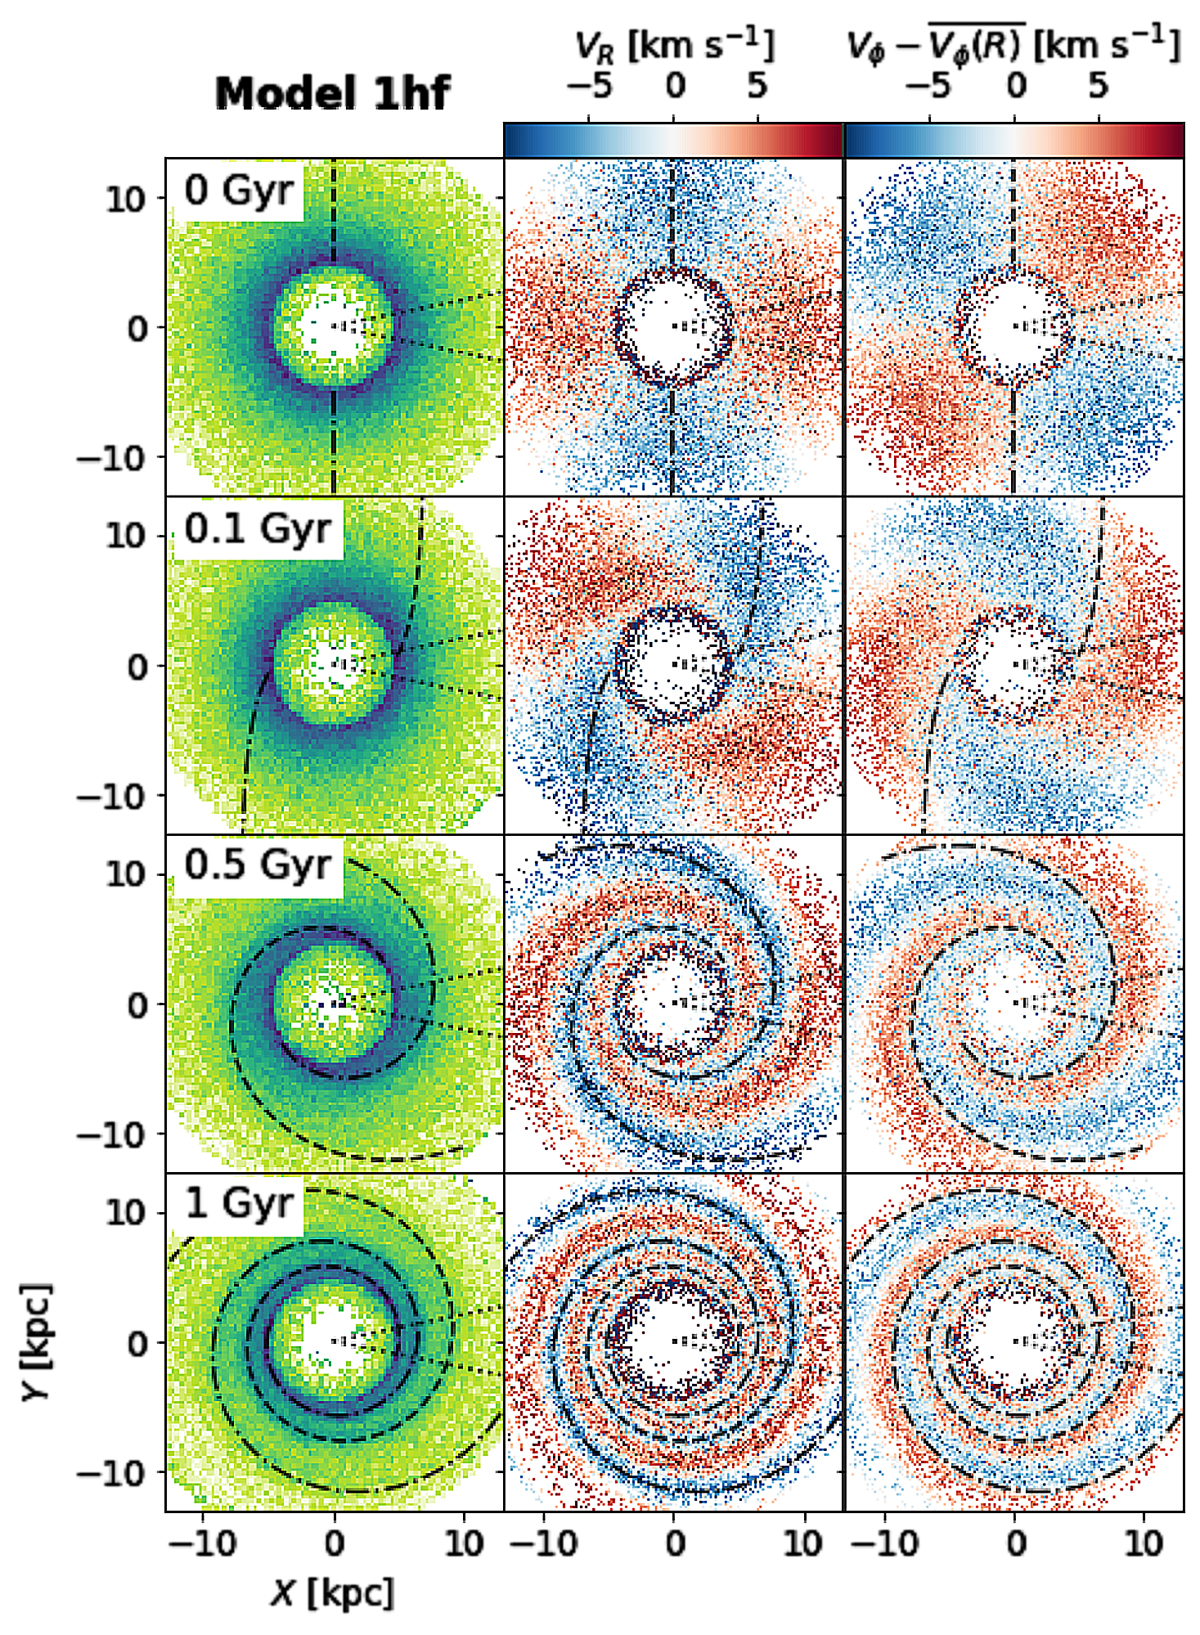
Tidal spiral arms of Model 1hf. We show the time evolution between 0 and 1 Gyr (indicated in the panels of the first column) of the disc in the X − Y space, in density (left column), coloured by average radial velocity VR (middle) and average azimuthal velocity ![]() (i.e. with respect to the mean at the given radius, third column). The dashed and dashed-dotted lines show the prediction of the spiral arms location following the winding with
(i.e. with respect to the mean at the given radius, third column). The dashed and dashed-dotted lines show the prediction of the spiral arms location following the winding with ![]() . The sector of the disc marked with dotted lines is a region whose dynamics we examine later in Fig. 6.
. The sector of the disc marked with dotted lines is a region whose dynamics we examine later in Fig. 6.
Current usage metrics show cumulative count of Article Views (full-text article views including HTML views, PDF and ePub downloads, according to the available data) and Abstracts Views on Vision4Press platform.
Data correspond to usage on the plateform after 2015. The current usage metrics is available 48-96 hours after online publication and is updated daily on week days.
Initial download of the metrics may take a while.