Fig. 1.
Download original image
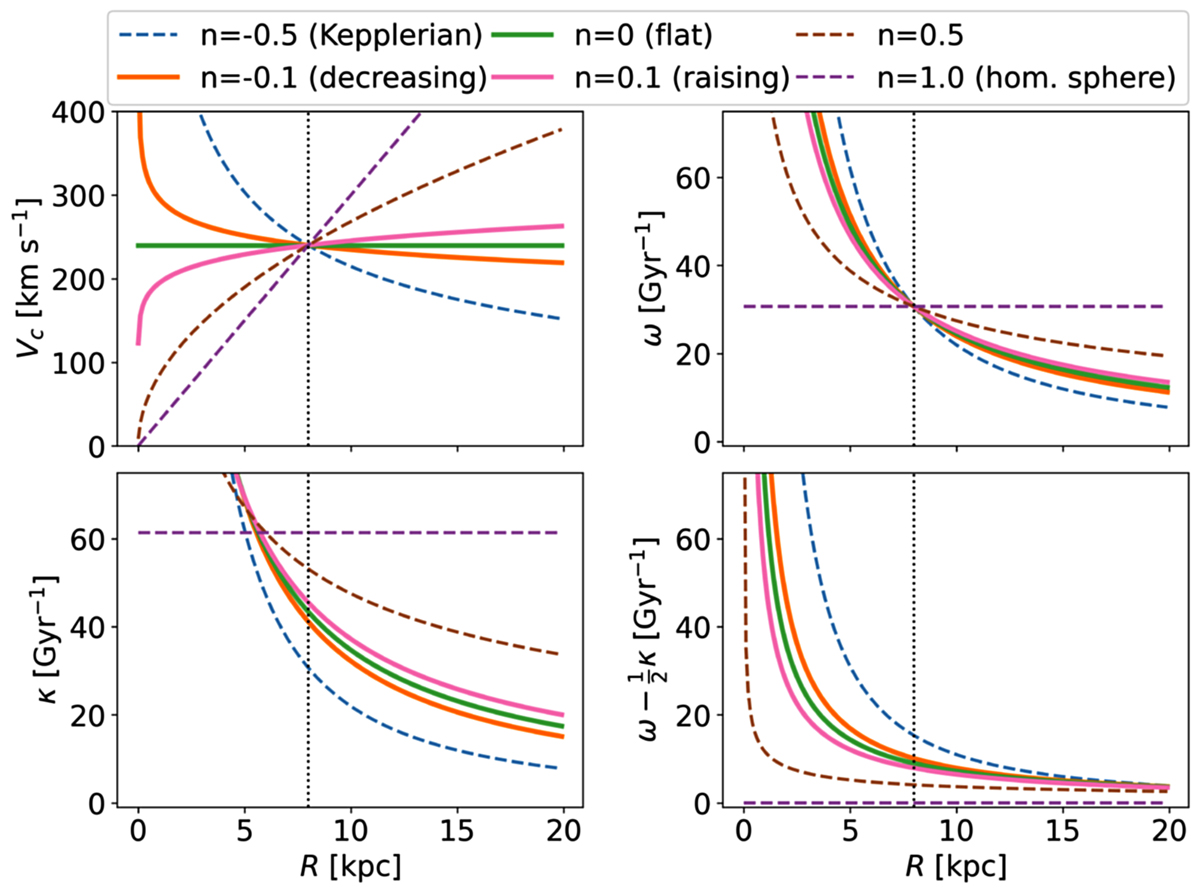
Circular velocity curve and frequencies for power-law models. We show potentials with different slopes indicated in the legend. The models used in the present study are shown as thicker solid lines, while dashed lines show other models for comparison. We show the circular velocity curve (top left), the azimuthal frequency (top right), the radial epicyclic frequency (bottom left) and ![]() (bottom right). The vertical dotted line marks the Sun’s position R0 = 8 kpc.
(bottom right). The vertical dotted line marks the Sun’s position R0 = 8 kpc.
Current usage metrics show cumulative count of Article Views (full-text article views including HTML views, PDF and ePub downloads, according to the available data) and Abstracts Views on Vision4Press platform.
Data correspond to usage on the plateform after 2015. The current usage metrics is available 48-96 hours after online publication and is updated daily on week days.
Initial download of the metrics may take a while.