Fig. 8
Download original image
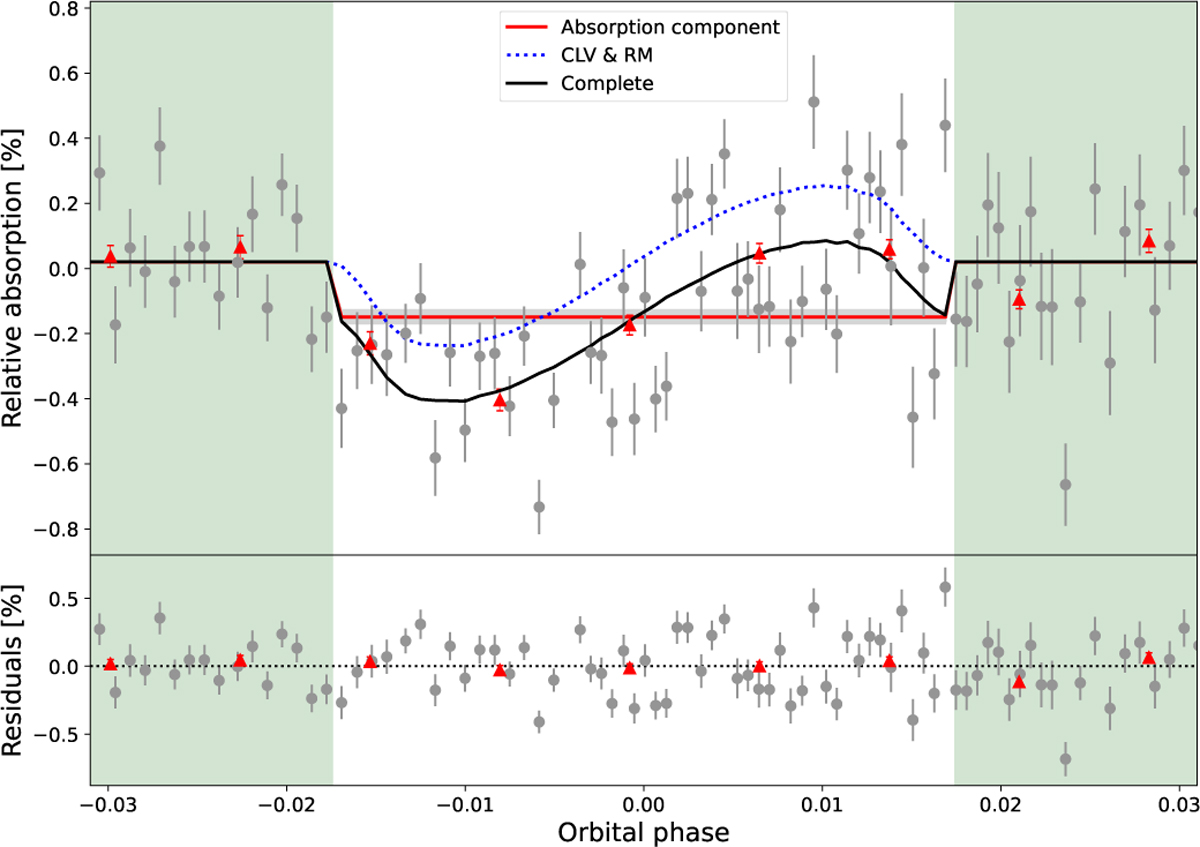
Transmission light curves of WASP-7 b around the Na i D2 line. Top panel: Observation transmission light curves (gray) and modeled transmission light curves of the RM and the CLV (dotted blue line) for the 0.45 Å integration band centered on the Na i D2 line. The dashed red line is the absorption component using a box model, and the gray shades denote its 1σ uncertainty. The solid black line is the best-fit combined model and the red points show binning by a factor of ten. Bottom panel: Residuals for binned and unbinned data. Green shades indicate out-of-transit time throughout.
Current usage metrics show cumulative count of Article Views (full-text article views including HTML views, PDF and ePub downloads, according to the available data) and Abstracts Views on Vision4Press platform.
Data correspond to usage on the plateform after 2015. The current usage metrics is available 48-96 hours after online publication and is updated daily on week days.
Initial download of the metrics may take a while.