Open Access
Fig. 6
Download original image
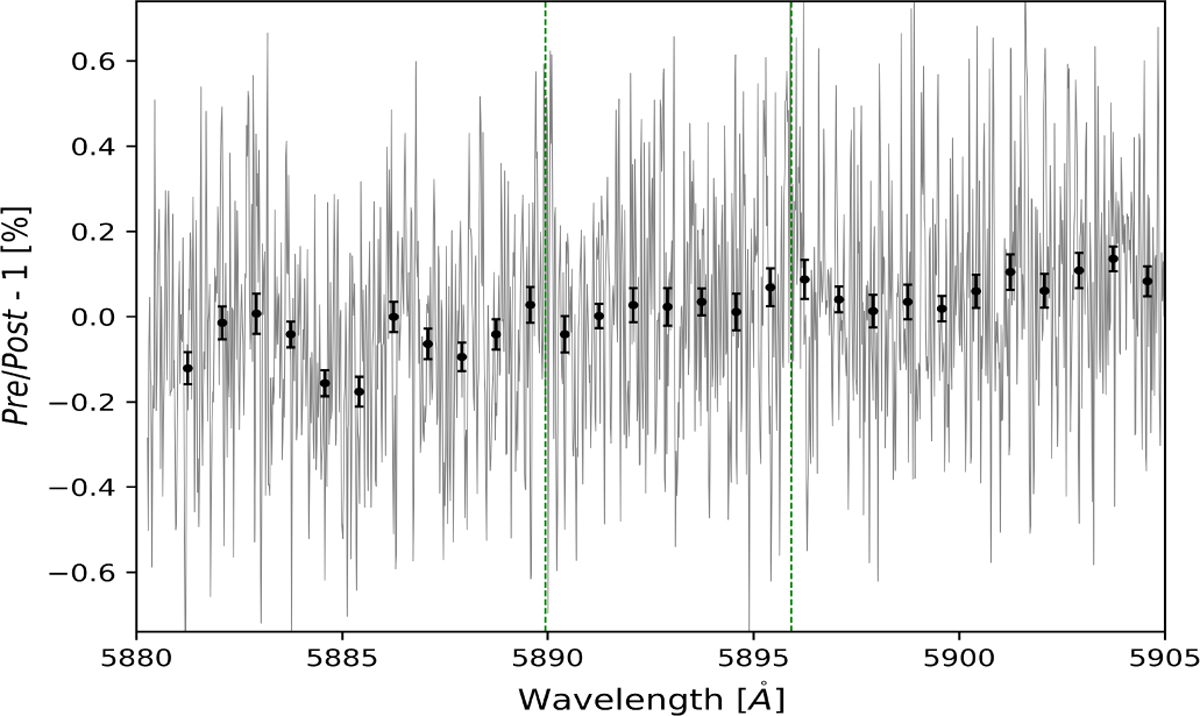
Ratio of pre- and post-transit master spectra (light gray) along with binned spectral ratio (black circles). Dashed vertical green lines indicate the centers of Na i lines.
Current usage metrics show cumulative count of Article Views (full-text article views including HTML views, PDF and ePub downloads, according to the available data) and Abstracts Views on Vision4Press platform.
Data correspond to usage on the plateform after 2015. The current usage metrics is available 48-96 hours after online publication and is updated daily on week days.
Initial download of the metrics may take a while.