Fig. A.1
Download original image
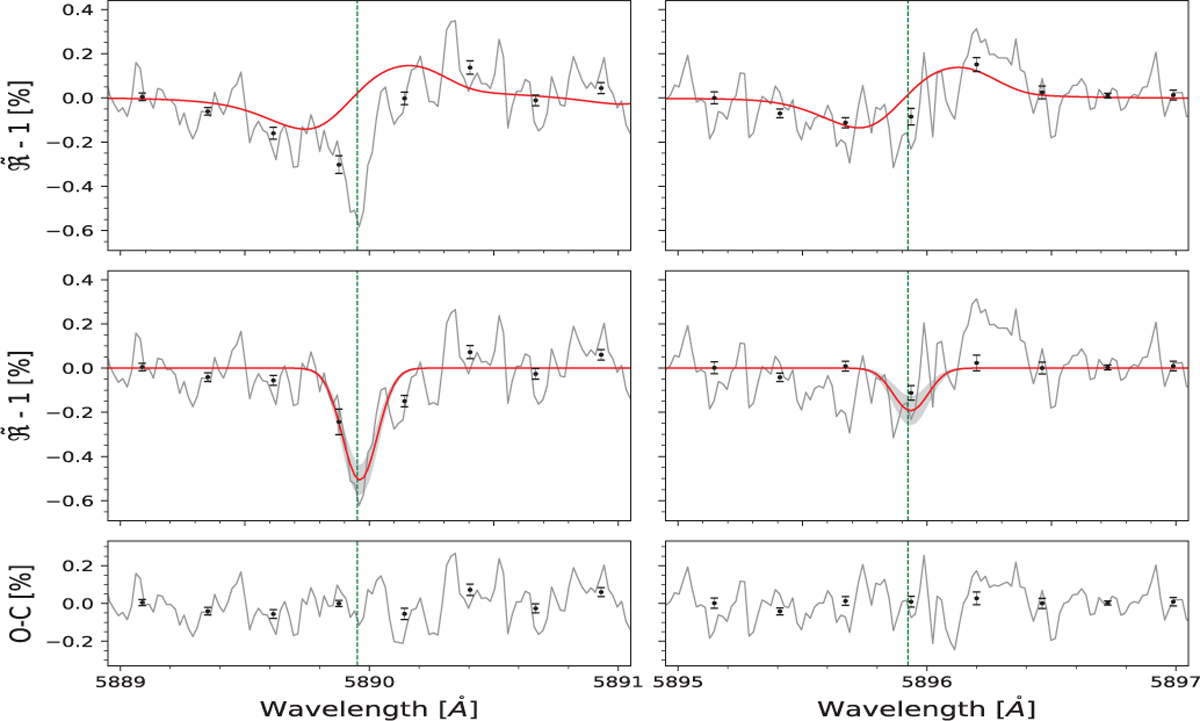
Transmission spectrum of WASP-7 b around the Na i D2 (left column) and Na i D1 line (right column) by disregarding ten post-transit spectra. Top panels: Observed transmission spectrum (gray) along with best-fit model components, representing the CLV and RM effects (solid red). Middle panels: Observed transmission spectrum with the best-fit Gaussian absorption components (red), and with the model shown in the upper panels subtracted (gray). The gray shades denote 1σ uncertainty of the best-fit model (red). Bottom panel: Residuals with respect to the best-fit model. The black data points correspond to binning by a factor of 15.
Current usage metrics show cumulative count of Article Views (full-text article views including HTML views, PDF and ePub downloads, according to the available data) and Abstracts Views on Vision4Press platform.
Data correspond to usage on the plateform after 2015. The current usage metrics is available 48-96 hours after online publication and is updated daily on week days.
Initial download of the metrics may take a while.