Open Access
Fig. 1
Download original image
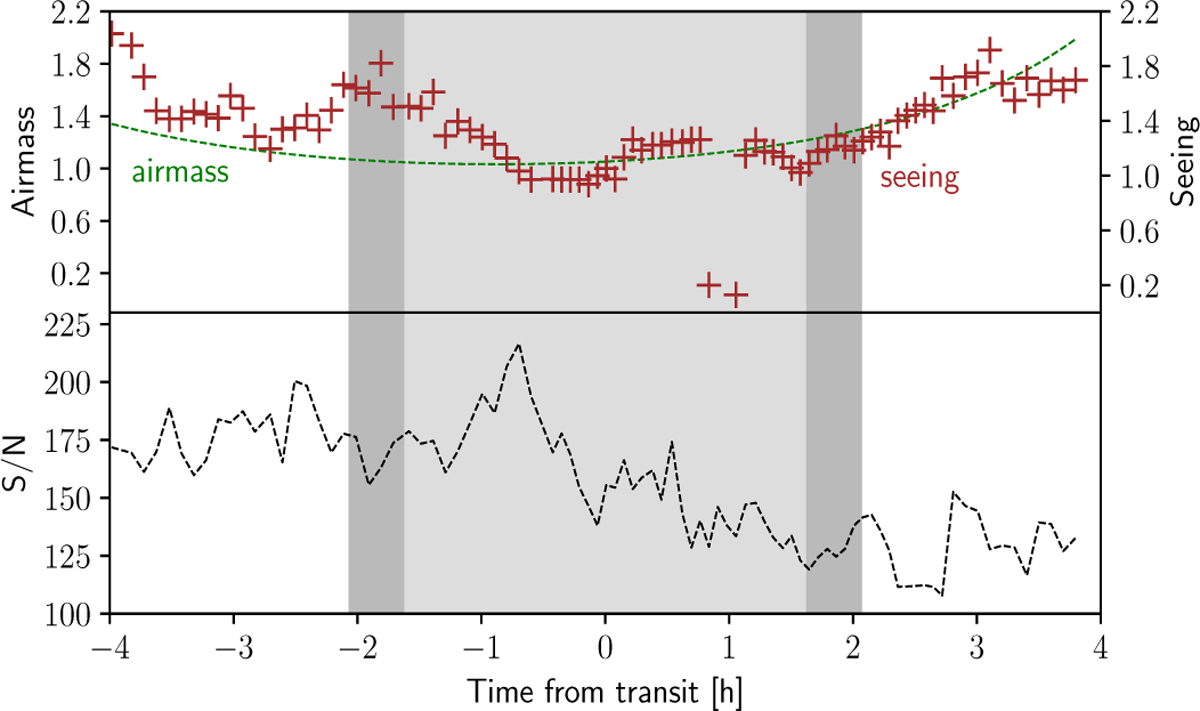
Time evolution of seeing in arcsec (brown crosses, top panel), airmass (dashed green lines, top panel), and S/N in the regions of the Na doublet lines (bottom panel). Dark gray shades indicate the ranges of ingress and egress, and light shades show the range between second and third contact.
Current usage metrics show cumulative count of Article Views (full-text article views including HTML views, PDF and ePub downloads, according to the available data) and Abstracts Views on Vision4Press platform.
Data correspond to usage on the plateform after 2015. The current usage metrics is available 48-96 hours after online publication and is updated daily on week days.
Initial download of the metrics may take a while.