Fig. 9
Download original image
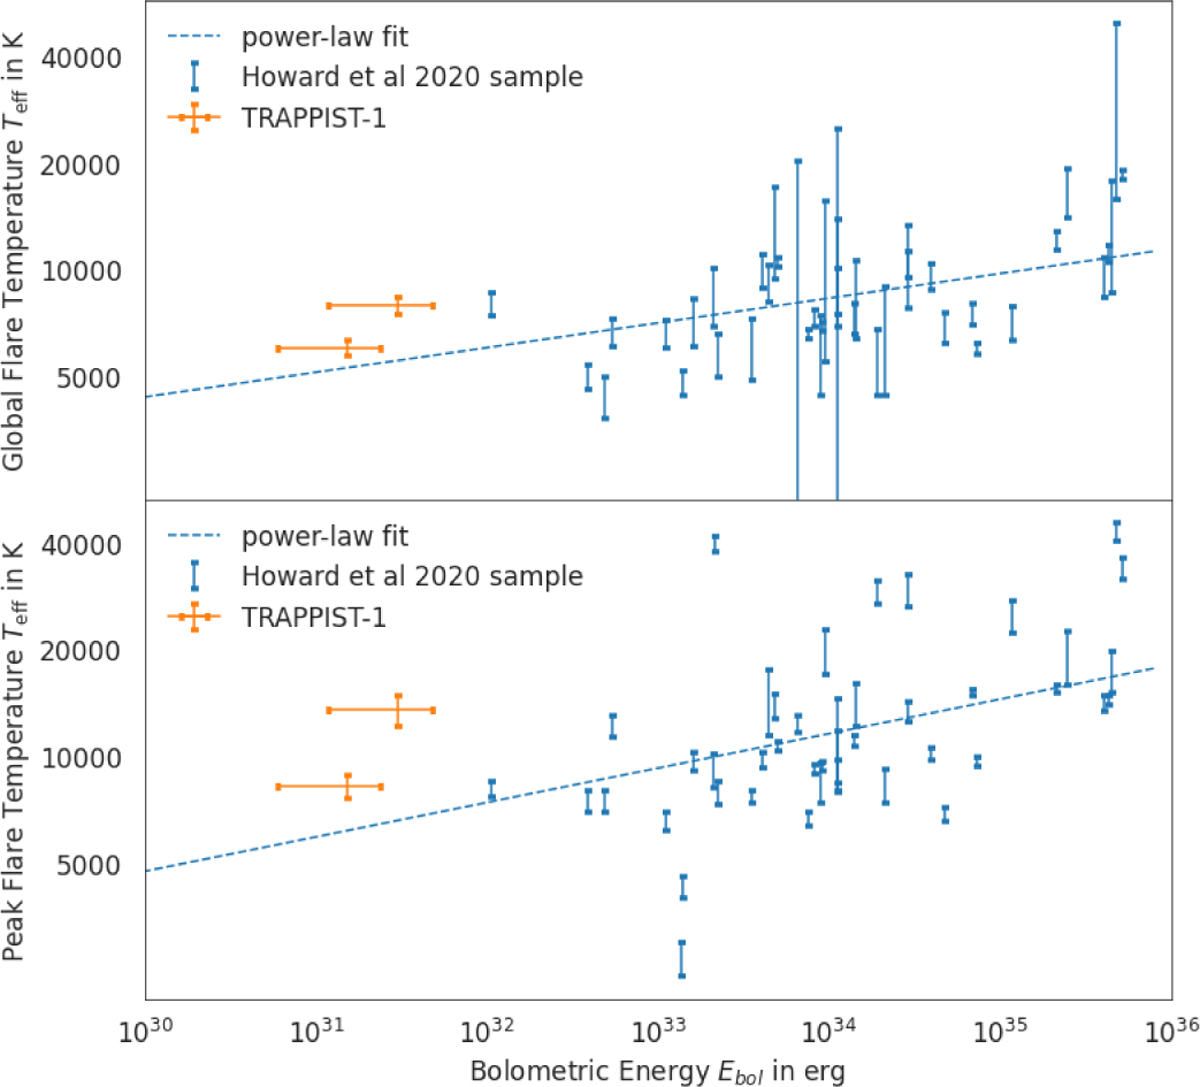
Energy-temperature relation in log-log representation: in the upper panel the global flare temperatures are plotted versus the bolometric energy, whereas in the lower panel the peak temperatures are used. The flares from Howard et al. (2020) are indicated in blue and our two TRAPPIST-1 flares are shown in orange. The blue dashed line indicates a power-law fit to the data.
Current usage metrics show cumulative count of Article Views (full-text article views including HTML views, PDF and ePub downloads, according to the available data) and Abstracts Views on Vision4Press platform.
Data correspond to usage on the plateform after 2015. The current usage metrics is available 48-96 hours after online publication and is updated daily on week days.
Initial download of the metrics may take a while.