Fig. 8
Download original image
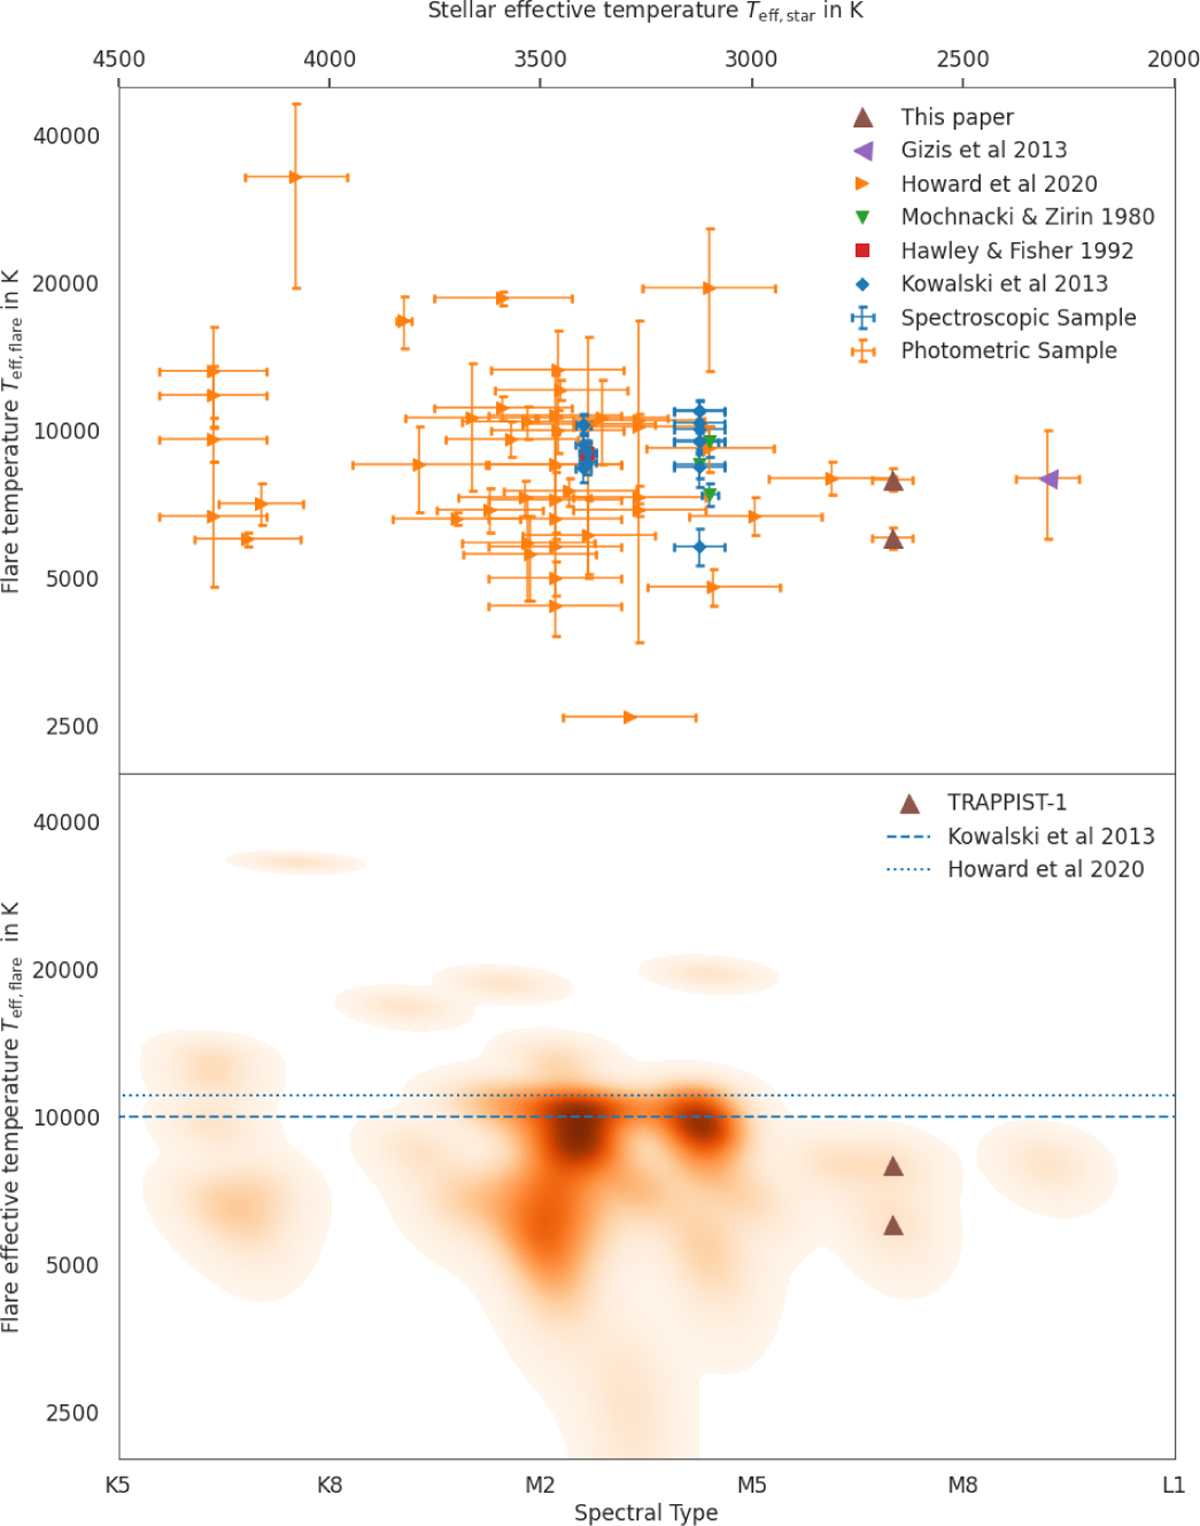
Spectral type and stellar effective temperature versus total flare temperature for different photometric and spectroscopic studies: The upper panel uses the stellar effective temperature if available from the TESS input catalogue (Stassun et al. 2019). For the Kowalski sample, we use conservative uncertainties of ±500 K. The lower panel shows a density map of flare temperatures per spectral type that is consistent with the upper stellar effective temperatures. The flare temperature axis is represented in log-scale. The two TRAPPIST-1 flares are overplotted and the blue horizontal lines represent the average temperatures from the two biggest temperature samples.
Current usage metrics show cumulative count of Article Views (full-text article views including HTML views, PDF and ePub downloads, according to the available data) and Abstracts Views on Vision4Press platform.
Data correspond to usage on the plateform after 2015. The current usage metrics is available 48-96 hours after online publication and is updated daily on week days.
Initial download of the metrics may take a while.