Fig. 7
Download original image
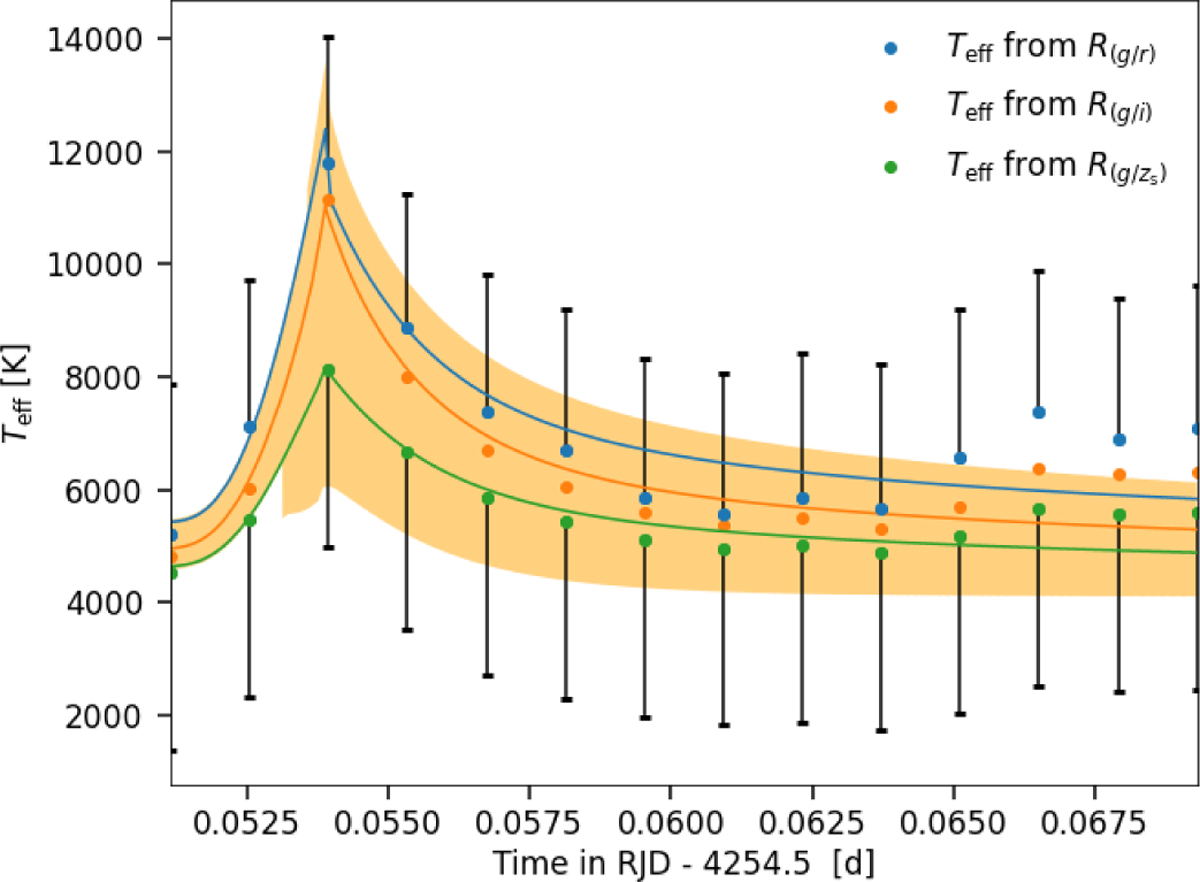
Temperature evolution of Flare 1: using the ratio functions Rj, we infer for each time step a flare color temperature by comparing the observed flux ratios with the theoretical black body flux ratios in between two MuSCAT filters using the χ2 method. Different ratio functions Rj yield different temperature evolutions. The uncertainty range is indicated by black markers and is valid for all three temperature evolutions. The lines represent the smoothly varying model for the flare color temperature which is derived from the best-fit parameters of the MCMC fitting to the flare light curve using the flare template aflare1. The orange shaded area gives the overlaid uncertainty of all three models.
Current usage metrics show cumulative count of Article Views (full-text article views including HTML views, PDF and ePub downloads, according to the available data) and Abstracts Views on Vision4Press platform.
Data correspond to usage on the plateform after 2015. The current usage metrics is available 48-96 hours after online publication and is updated daily on week days.
Initial download of the metrics may take a while.