Fig. 4
Download original image
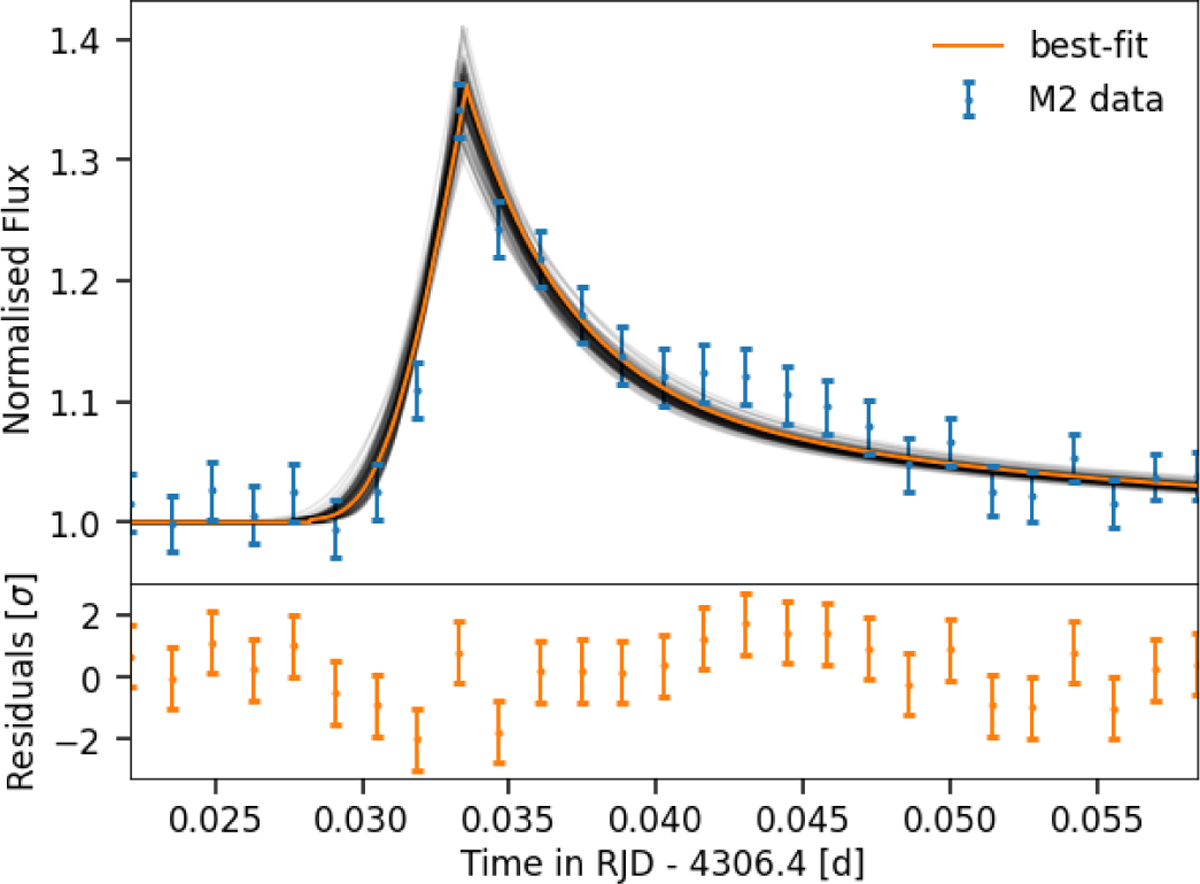
Flux profile fit of Flare 2 with M2 r-filter data: the orange curve indicates the best-fit using the flare template aflare1. The black lines show 100 random samples from the Markov chain. The lower panel shows the residuals between the observation and the model. The corresponding posterior probability distribution of the MCMC-fit is shown in Fig. B.1. The lower panel reveals systematic errors in the residuals which might be due to superimposed flares or oscillations. This is further discussed in Sect. 5.
Current usage metrics show cumulative count of Article Views (full-text article views including HTML views, PDF and ePub downloads, according to the available data) and Abstracts Views on Vision4Press platform.
Data correspond to usage on the plateform after 2015. The current usage metrics is available 48-96 hours after online publication and is updated daily on week days.
Initial download of the metrics may take a while.