Open Access
Fig. 2
Download original image
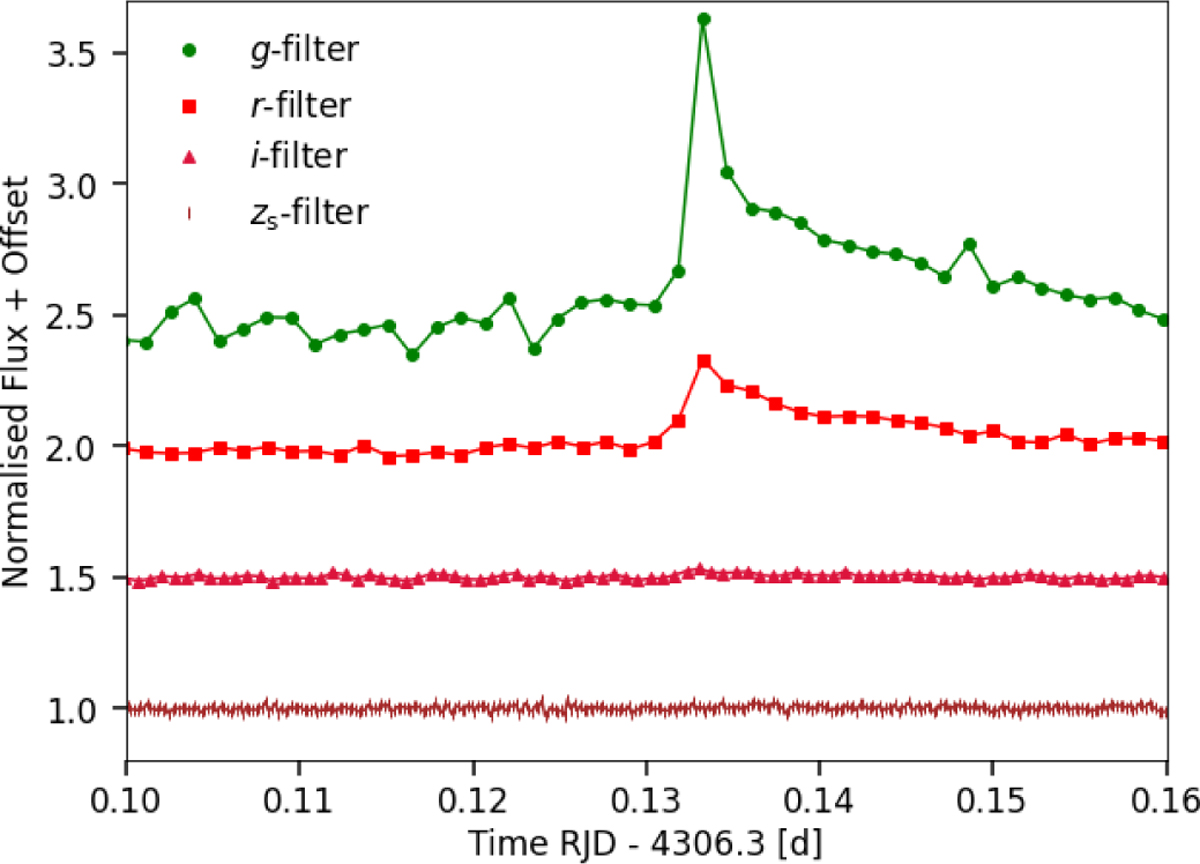
Light curve in all four filters of MuSCAT2 (M2) of Flare 2: the flare is visible in the g- and r-filter, whereas the S/N in the i- and zs-filter are too low. Time and flux are as indicated in Fig. 1.
Current usage metrics show cumulative count of Article Views (full-text article views including HTML views, PDF and ePub downloads, according to the available data) and Abstracts Views on Vision4Press platform.
Data correspond to usage on the plateform after 2015. The current usage metrics is available 48-96 hours after online publication and is updated daily on week days.
Initial download of the metrics may take a while.