Open Access
Fig. C.6
Download original image
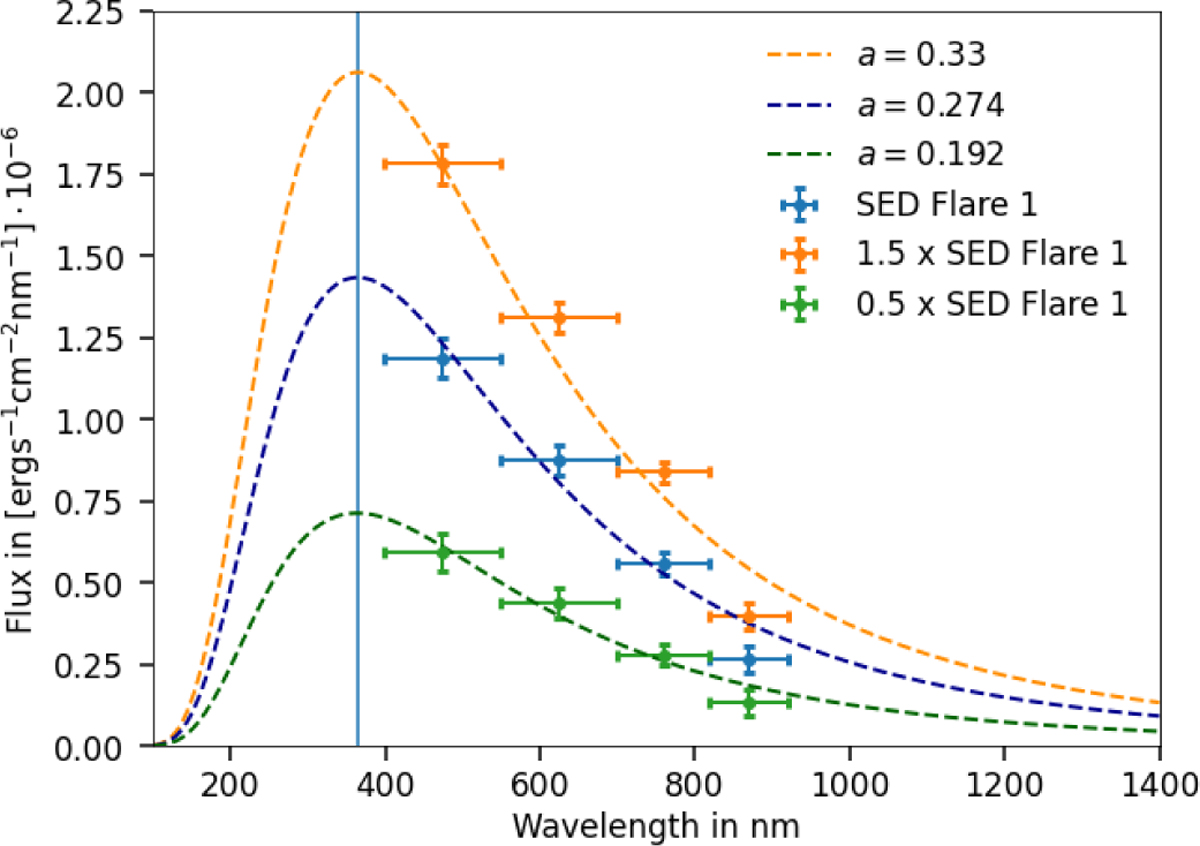
Model sensitivity test for the flare area parameter: three SEDs are shown for Flare 1. The blue SED indicates the SED with absolute calibration to Gaia and the orange and green curves represent fluxes with altered SEDs.
Current usage metrics show cumulative count of Article Views (full-text article views including HTML views, PDF and ePub downloads, according to the available data) and Abstracts Views on Vision4Press platform.
Data correspond to usage on the plateform after 2015. The current usage metrics is available 48-96 hours after online publication and is updated daily on week days.
Initial download of the metrics may take a while.