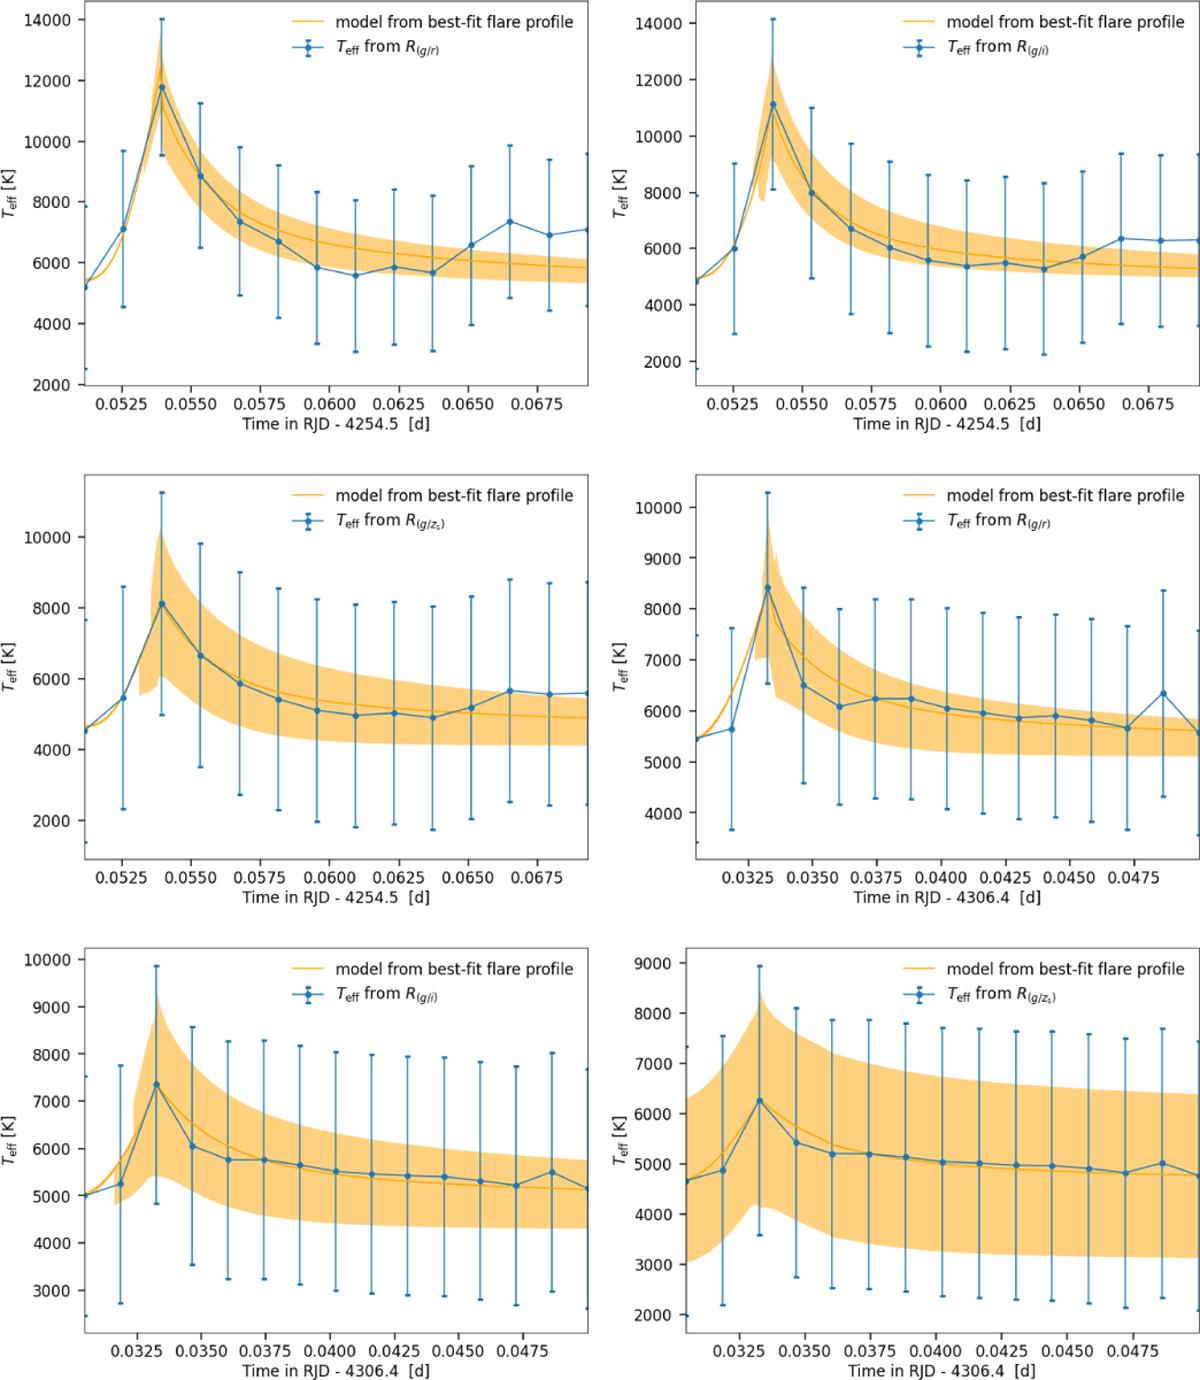
Fig. C.4
Download original image
Color-temperature evolution for both observed TRAPPIST-1 flare with MuSCAT 2. In the left column, all temperature evolutions for the different filter ratio functions Rj(Teff) are shown, and in the right column, the same is done for flare 2. The orange line indicates the model drawn from the best-fit to the flare flux profile, with respective model uncertainties represented by the orange shaded areas.
Current usage metrics show cumulative count of Article Views (full-text article views including HTML views, PDF and ePub downloads, according to the available data) and Abstracts Views on Vision4Press platform.
Data correspond to usage on the plateform after 2015. The current usage metrics is available 48-96 hours after online publication and is updated daily on week days.
Initial download of the metrics may take a while.