Open Access
Fig. C.3
Download original image
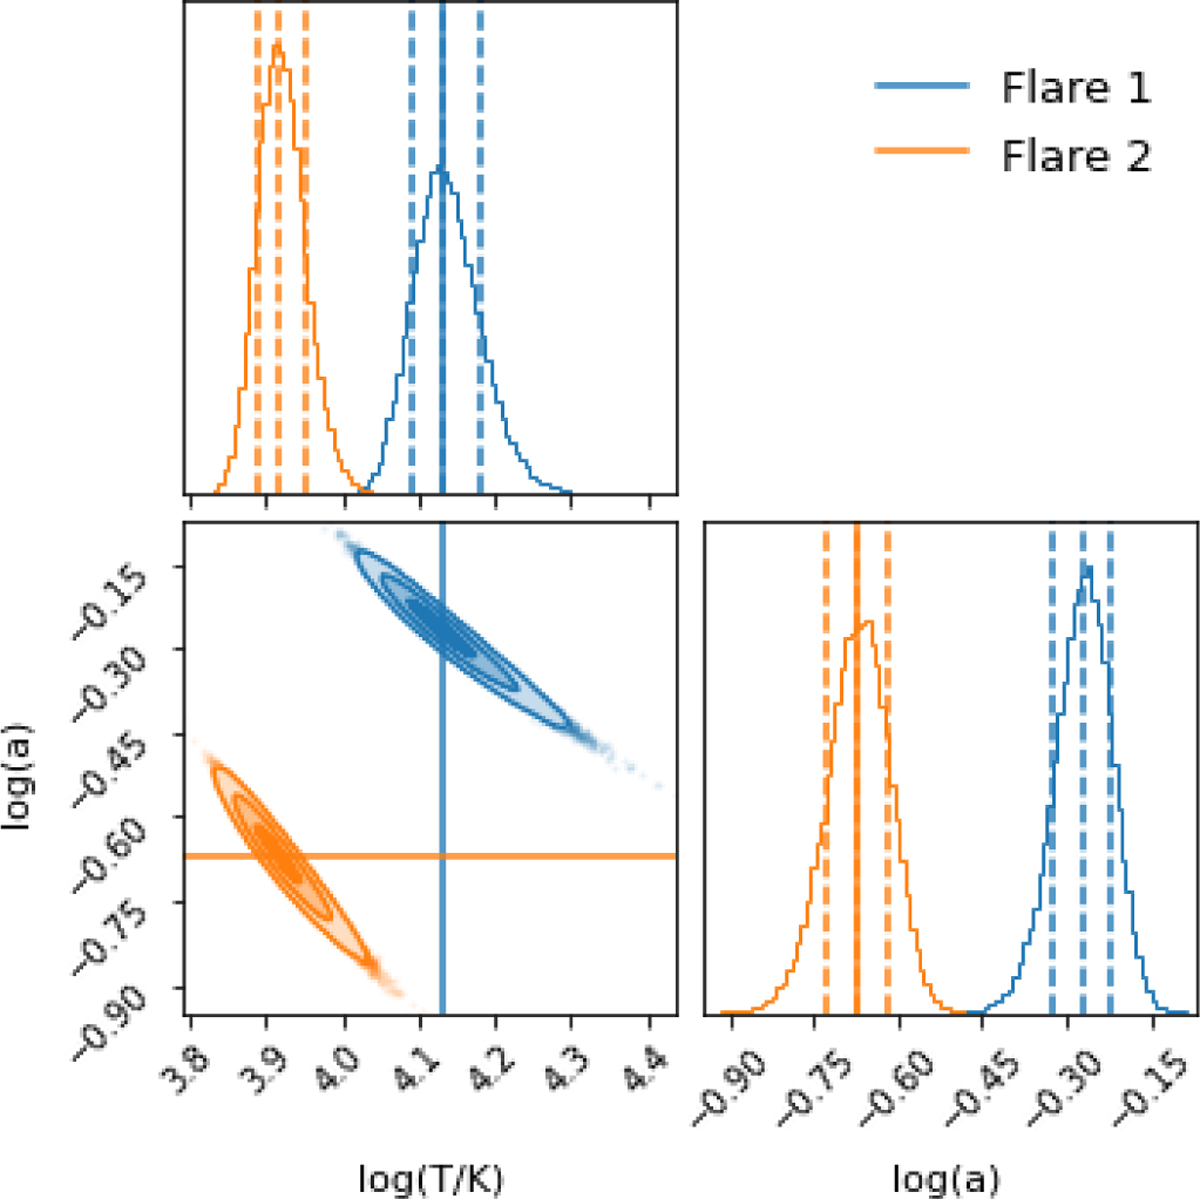
Posterior probability distribution for both peak flare samples: The sample of flare 1 is represented in blue and the samples of flare 2 are in orange. The sampling is done in logarithmic parameter space such that both the temperature T and the area parameter a are given on logarithmic scale.
Current usage metrics show cumulative count of Article Views (full-text article views including HTML views, PDF and ePub downloads, according to the available data) and Abstracts Views on Vision4Press platform.
Data correspond to usage on the plateform after 2015. The current usage metrics is available 48-96 hours after online publication and is updated daily on week days.
Initial download of the metrics may take a while.