Open Access
Fig. A.1
Download original image
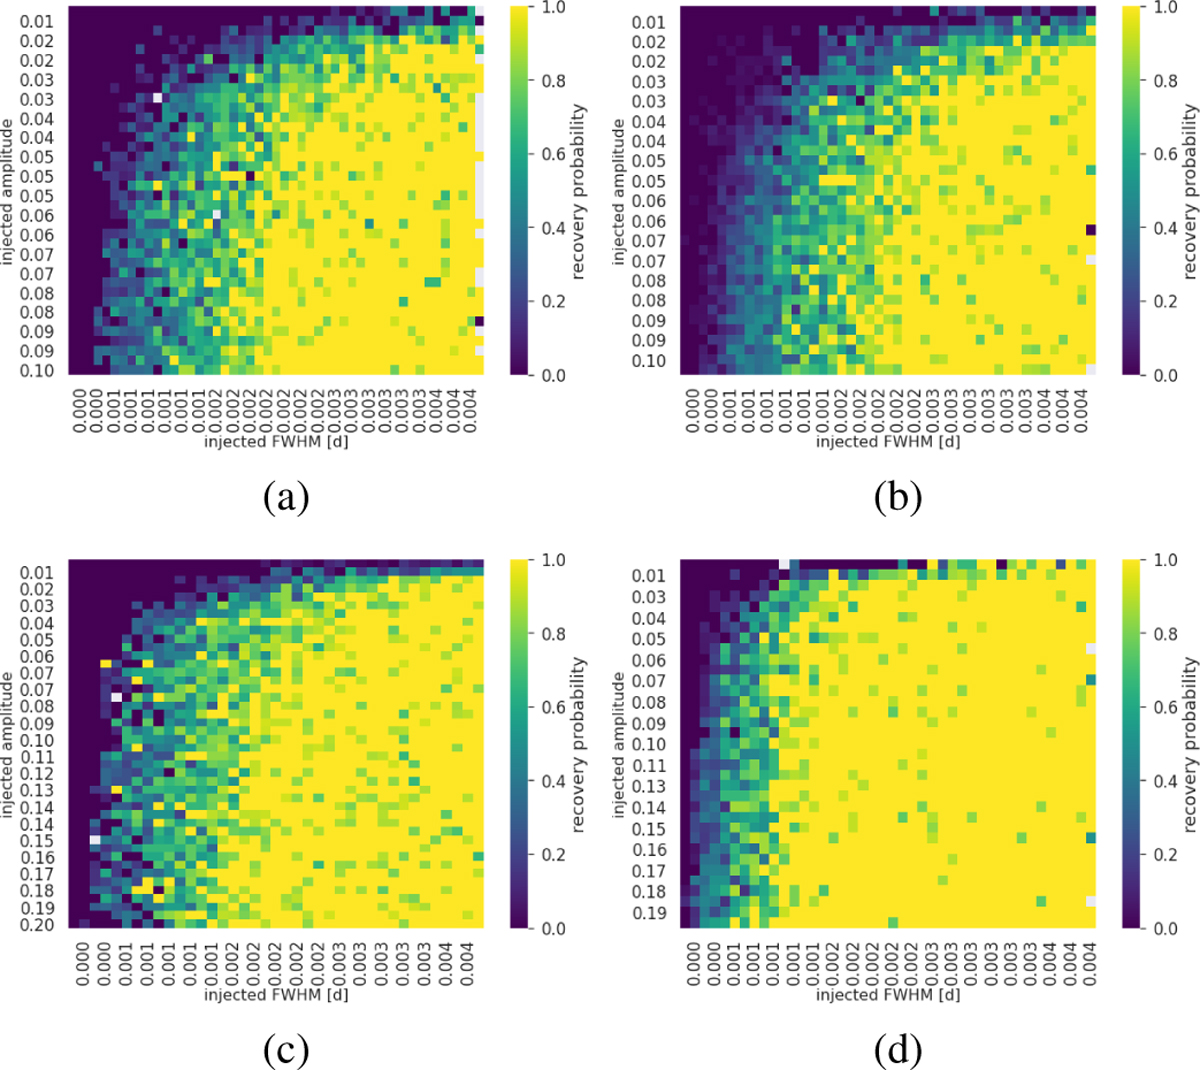
Flare injection recovery via heat maps for each MuSCAT 2 (M2) filter, Panels (a),(b),(c), and (d) correspond to the M2 g, r, i and zs photometric filters. The detection limits in amplitude and FWHM of the flares are for all bands visible and marked by the dark regions where the recovery probability is low.
Current usage metrics show cumulative count of Article Views (full-text article views including HTML views, PDF and ePub downloads, according to the available data) and Abstracts Views on Vision4Press platform.
Data correspond to usage on the plateform after 2015. The current usage metrics is available 48-96 hours after online publication and is updated daily on week days.
Initial download of the metrics may take a while.