Fig. 11
Download original image
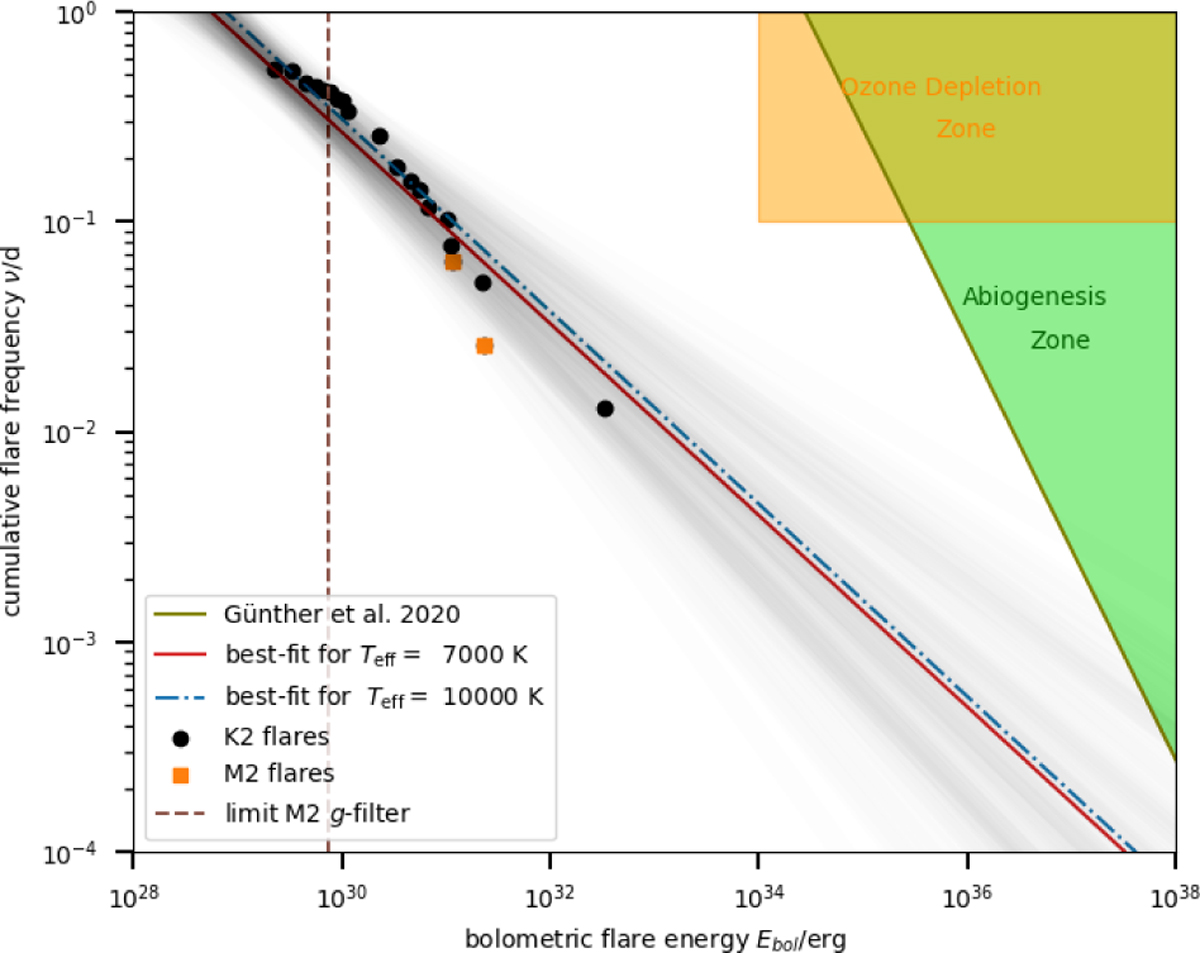
Flare frequency distribution for K2 and M2 data. The FFD for TRAPPIST-1 is updated by our flares indicated in orange. The black points are adopted from (Paudel et al. 2018). The best fit to the power law is chosen from 2500 MC trials, here only 100 random samples are shown to mark the uncertainty of the model. Also overplotted are the abiogenesis zone in green (Rimmer et al. 2018; Günther et al. 2020) and the ozone-depletion zone in yellow (Tilley et al. 2019; Günther et al. 2020) for TRAPPIST-1.
Current usage metrics show cumulative count of Article Views (full-text article views including HTML views, PDF and ePub downloads, according to the available data) and Abstracts Views on Vision4Press platform.
Data correspond to usage on the plateform after 2015. The current usage metrics is available 48-96 hours after online publication and is updated daily on week days.
Initial download of the metrics may take a while.