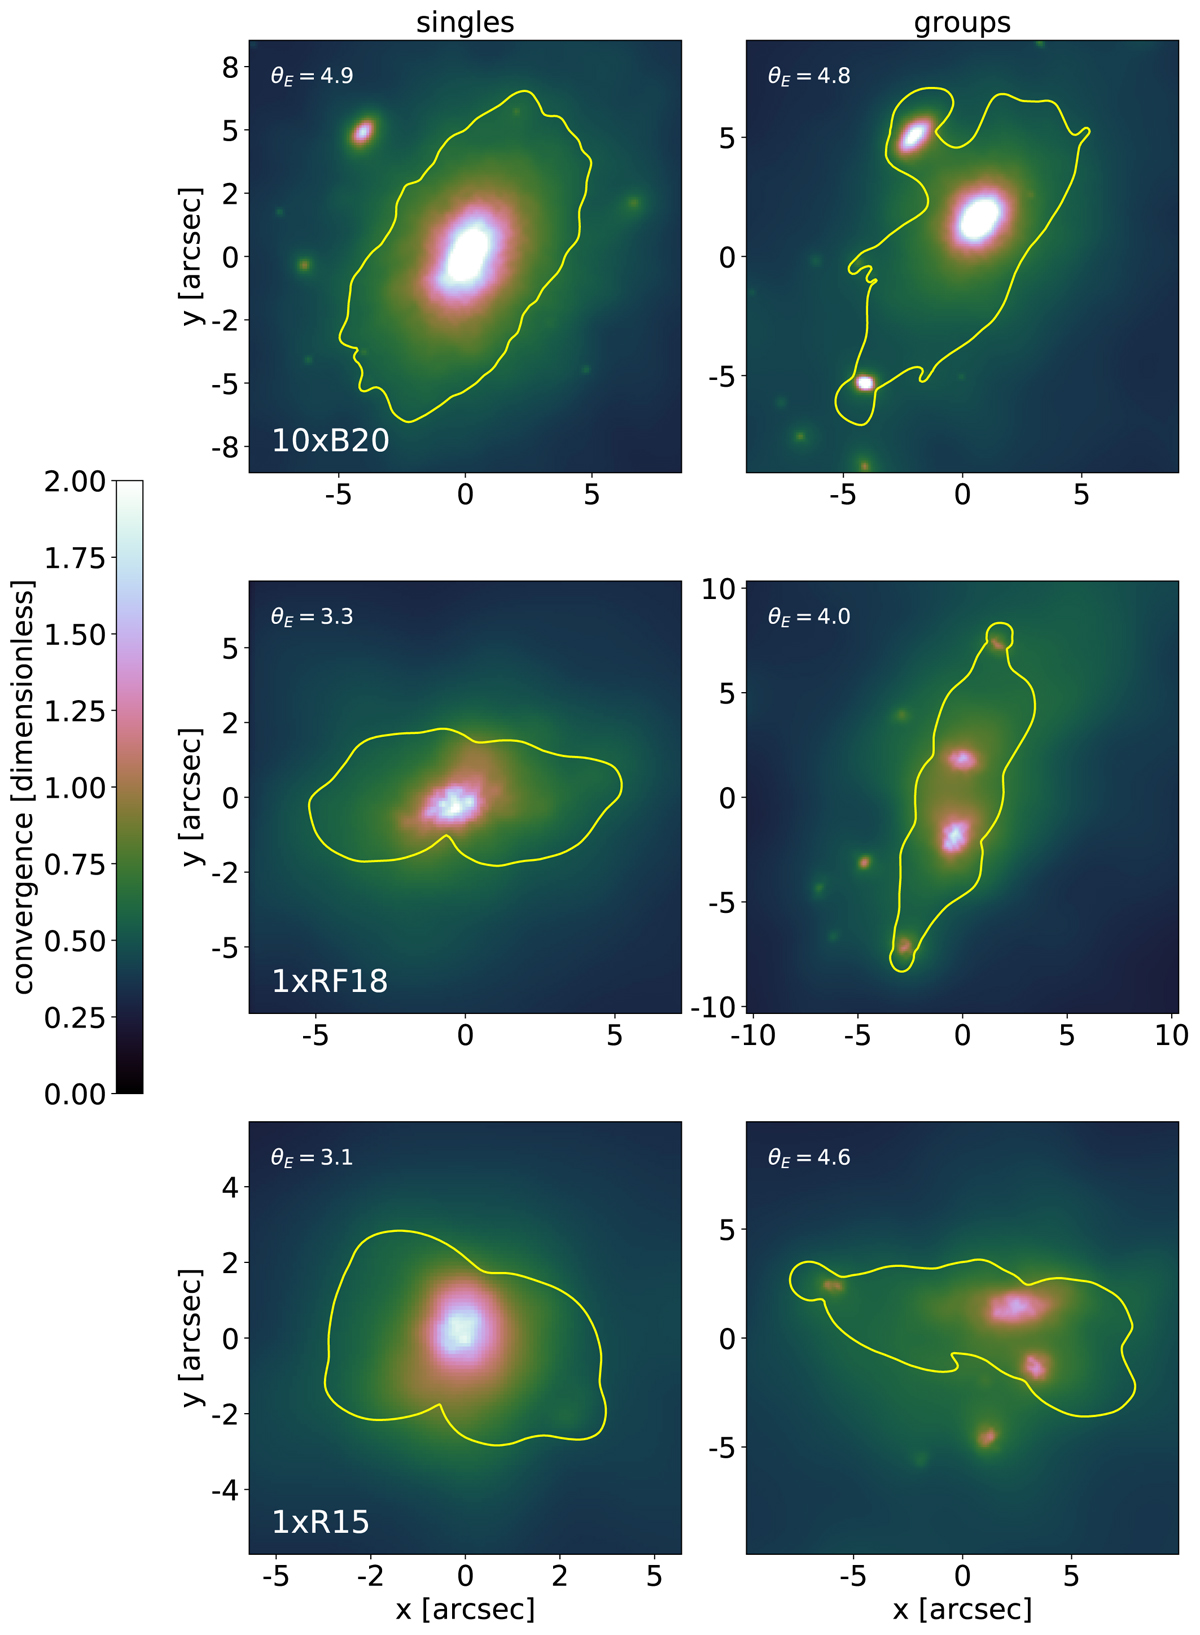
Fig. 9.
Download original image
Secondary critical lines in the simulated data sets. The yellow lines in the left and right panels show examples of critical lines with θE > θE, cut, classified as “singles” and “groups,” respectively. From the upper to the bottom panels, the critical lines (for zs = 6) are overlaid onto the convergence maps of simulated clusters in the 10x, 1xRF18, and 1xR15 samples. The value of the corresponding Einstein radius is reported in each panel.
Current usage metrics show cumulative count of Article Views (full-text article views including HTML views, PDF and ePub downloads, according to the available data) and Abstracts Views on Vision4Press platform.
Data correspond to usage on the plateform after 2015. The current usage metrics is available 48-96 hours after online publication and is updated daily on week days.
Initial download of the metrics may take a while.