Fig. 8.
Download original image
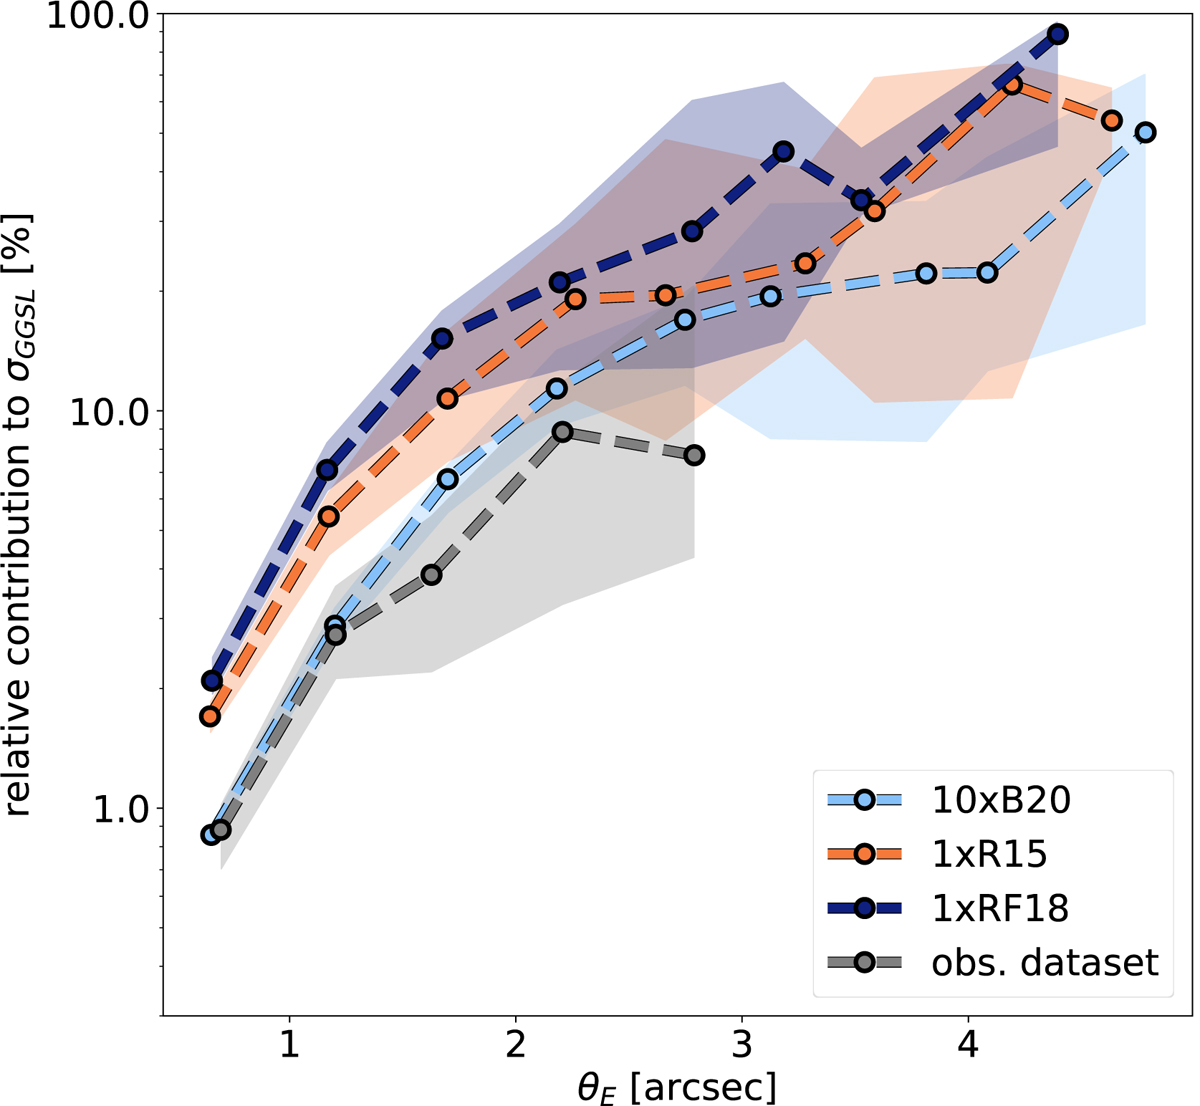
Median relative contribution of galaxies with Einstein radius θE to the GGSL cross section of the host cluster. We assume zs = 6. The dashed black line shows the results for the observational data set. The dashed light blue, orange, and dark blue lines refer to the 10xB20, 1xR15, and 1xRF18 simulation data sets, respectively. The colored bands show the 99% confidence limits of the median.
Current usage metrics show cumulative count of Article Views (full-text article views including HTML views, PDF and ePub downloads, according to the available data) and Abstracts Views on Vision4Press platform.
Data correspond to usage on the plateform after 2015. The current usage metrics is available 48-96 hours after online publication and is updated daily on week days.
Initial download of the metrics may take a while.