Fig. 7.
Download original image
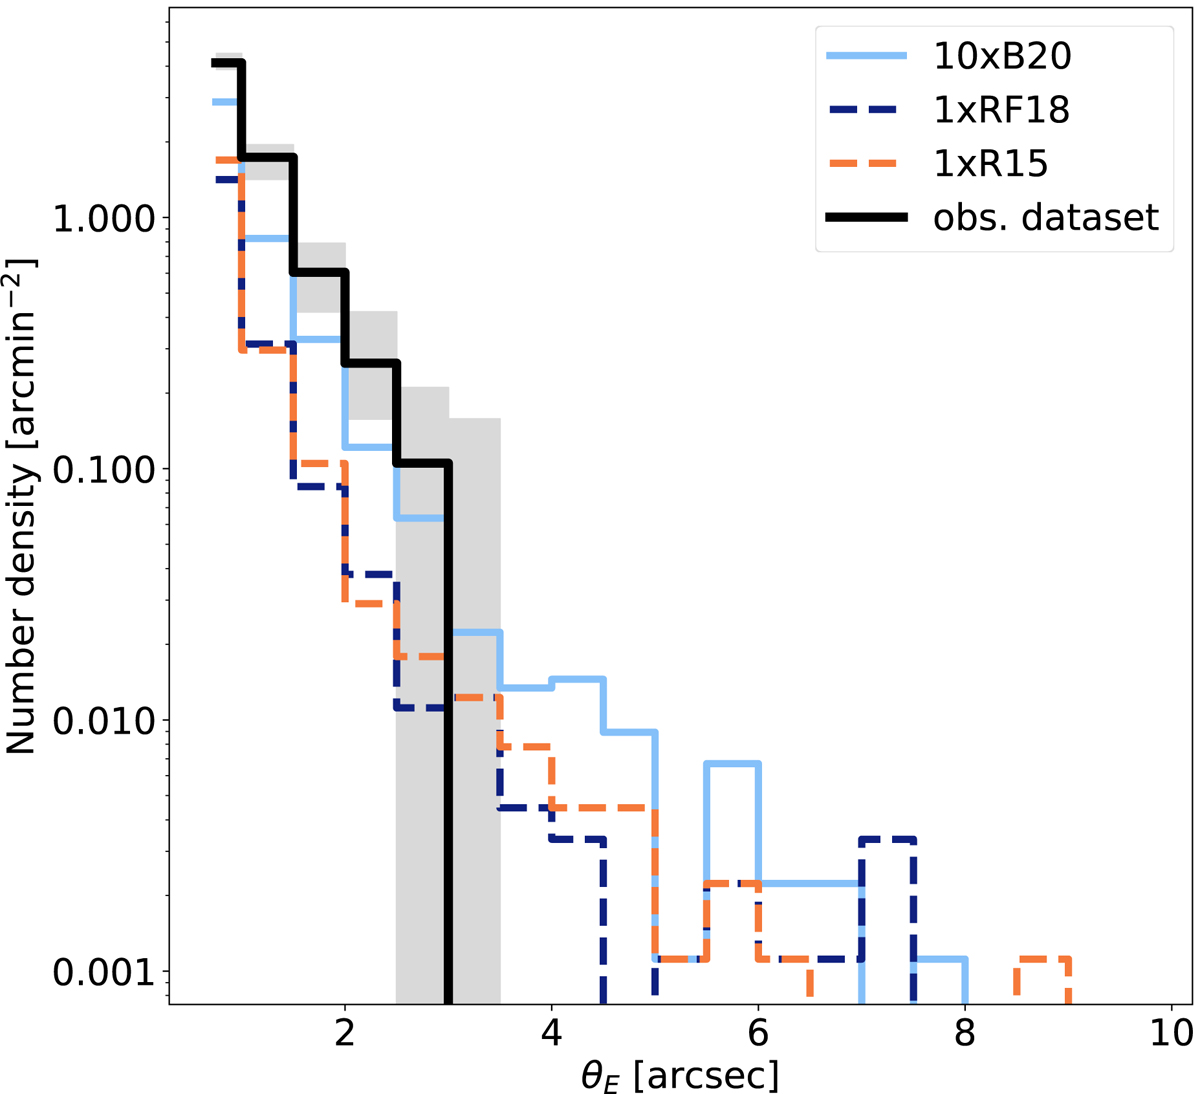
Number density of secondary critical lines (for zs = 6) as a function of their equivalent Einstein radius, θE. We show the results for the observational data set with the black histogram. The gray band indicates their 100% confidence limits. The light blue, dark blue, and orange histograms show the results for the 10xB20, 1xRF18, and 1xR15 simulation data sets, respectively.
Current usage metrics show cumulative count of Article Views (full-text article views including HTML views, PDF and ePub downloads, according to the available data) and Abstracts Views on Vision4Press platform.
Data correspond to usage on the plateform after 2015. The current usage metrics is available 48-96 hours after online publication and is updated daily on week days.
Initial download of the metrics may take a while.