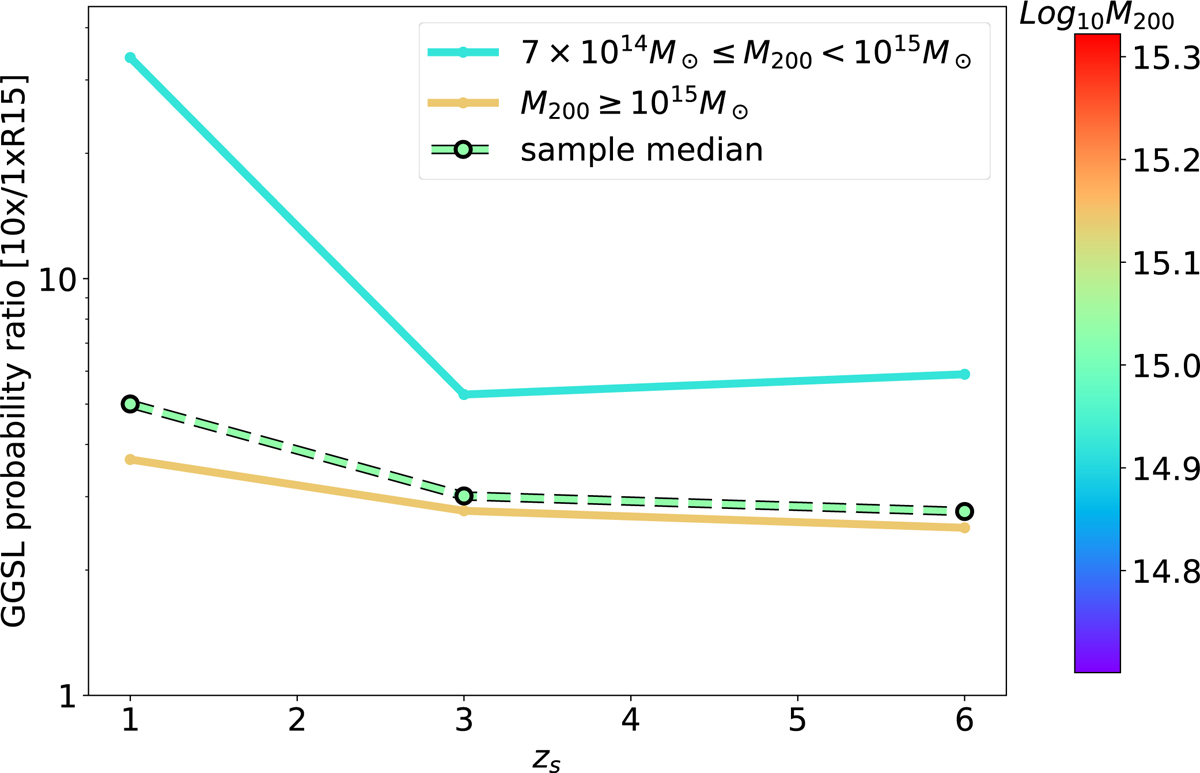
Fig. 4.
Download original image
Median ratio of the GGSL probabilities in the 10xB20 sample to those in the 1xR15 sample as a function of the source redshift. We show the results separately for clusters with masses larger and smaller than 1015 M⊙, as shown by the different colors of the solid lines. The dashed line shows the median ratio of the GGSL probabilities in the whole sample.
Current usage metrics show cumulative count of Article Views (full-text article views including HTML views, PDF and ePub downloads, according to the available data) and Abstracts Views on Vision4Press platform.
Data correspond to usage on the plateform after 2015. The current usage metrics is available 48-96 hours after online publication and is updated daily on week days.
Initial download of the metrics may take a while.