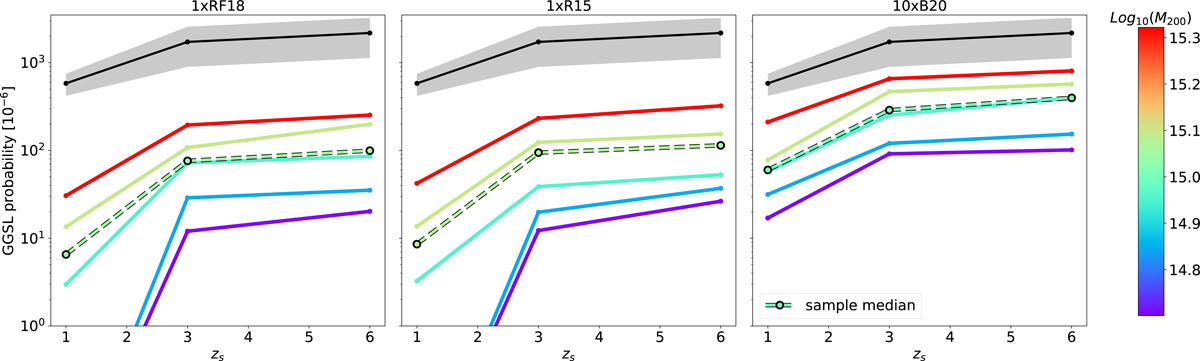
Fig. 3.
Download original image
GGSL probability as a function of the source redshift. The mean GGSL probability among our observational sample is shown with the solid black line in all panels. The gray color band shows the 99% confidence interval, computed by bootstrap sampling. The results for the 1xRF18, 1xR15, and 10xB20 simulation sets are shown in the left, central, and right panels, respectively. Each solid colored line corresponds to the median of GGSL probability in mass bins. The colors reflect the cluster mass, as indicated in the color bar on the right. The dashed black lines show the median probability among all cluster projections.
Current usage metrics show cumulative count of Article Views (full-text article views including HTML views, PDF and ePub downloads, according to the available data) and Abstracts Views on Vision4Press platform.
Data correspond to usage on the plateform after 2015. The current usage metrics is available 48-96 hours after online publication and is updated daily on week days.
Initial download of the metrics may take a while.