Fig. 2.
Download original image
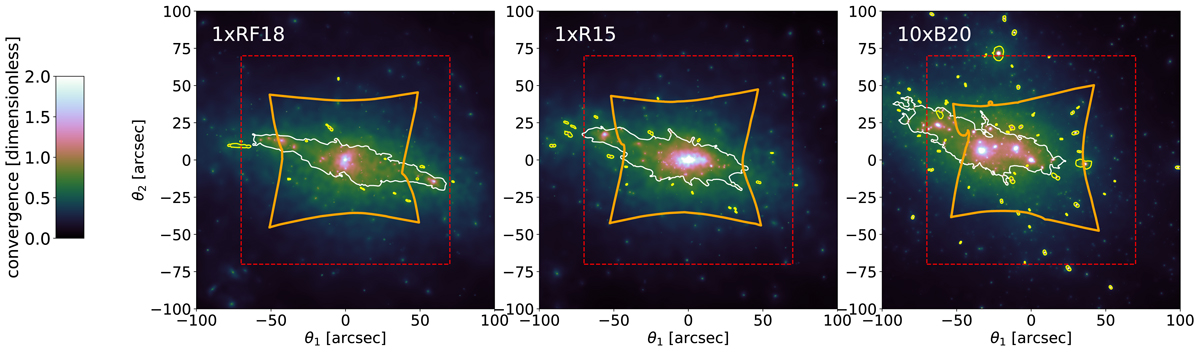
Examples of convergence map for zs = 3 for a simulated cluster at zl ∼ 0.4. The left, central, and right panels show the maps for the same halo in the 1xRF18, 1xR15, and 10xB20 samples. The solid white and yellow lines show the primary and secondary tangential critical lines. The dashed red line indicates the region where we identify the secondary critical lines for measuring the GGSL probability. The solid orange line shows the boundaries of this region on the source plane.
Current usage metrics show cumulative count of Article Views (full-text article views including HTML views, PDF and ePub downloads, according to the available data) and Abstracts Views on Vision4Press platform.
Data correspond to usage on the plateform after 2015. The current usage metrics is available 48-96 hours after online publication and is updated daily on week days.
Initial download of the metrics may take a while.